“Some people remember where they were the exact moment when Elvis died or when Kennedy was shot. I remember the exact moment in time I discovered Mark Wahlberg was Marky Mark…” -T Haj (via YouTube).
Many people have heard of the modern-day Mark Wahlberg, as he’s been an A-list celebrity for many years and was even the world’s best-paid actor in 2017. Far fewer people – especially those coming of age in the early 90s (like yours truly) – likely remember his bringing the world Good Vibrations as the leader of Marky Mark & The Funky Bunch. Although it wasn’t the type of music my supercool-hockey-playing-skateboarding friends and I actively listened to, that song certainly evokes some nostalgic feeling of that era. And I’m sure Mark Wahlberg will be happy to know that his former persona can still inspire both hilarious quotes and puns of questionable quality (like today’s title).
Picking up where we left off in the last alt.Blend, we’re now looking for our B-squad: investment strategies that can help replace a portion of traditional bonds (especially US Treasuries) that will no longer provide the income or total-return needed for adequate portfolio longevity. And, as I previously mentioned, there won’t be any perfect solutions, so this rethinking of portfolios will also require some adjustment of our expectations, and that’s where today’s title comes in. Today will focus more on the expectations-setting, and the next piece – likely the last in this miniseries – will outline solutions.
Bond Voyage
Below is a table that contains periodic returns at key times of market volatility over the past 20 years, including the Dot-com Bust, the 2008 Financial Crisis, and 2020’s COVID selloff/rebound. Without getting too far into the weeds of this (and without capturing a lot of underlying nuances or daily movements, as these are very general index returns over months, quarters, and years), there are some useful takeaways we can garner from the data:
These three timeframes all involved significant market volatility, but the Dot-com Bust impact affected a narrower segment of markets. All three areas of bonds (Treasuries, municipals, and credit) did a fantastic job of offsetting the stock losses, and a “standard” balanced portfolio would have held up very well through that downturn of the early 2000s.
In the 2008 Financial Crisis and COVID Panic, things were different: those who expected all of their bonds to offer the protection reminiscent of the Dot-com Crash were in for a surprise. As equity markets began their decline in late 2007, Treasuries did very well, and munis/credit stood their ground. However, as we moved deeper into the realities of the crisis, municipals and credit holdings began to falter a bit and then decline more substantially, with municipals finishing 2008 down nearly -10% on the year, while treasuries were up almost 25%.
I was about three years into my financial services career in late 2008. I recall sitting in our offices in Wilmington, Delaware, being both confused and a bit upset, as munis were not holdings we expected to lose 10% or more for our clients. Yes, they were holding-up far better than the equity markets, but the moderate decline was a difficult pill to swallow. Thankfully, my team and I didn’t panic or sell. Then, in 2009, equity markets rapidly recovered and – as we can see from the table – Treasuries remained negatively correlated to stocks and fell -13% by year-end, while munis and credit ultimately had an impressive rebound (up about 20% and 19%, respectively).
We can see something similar in the data during the onset of COVID-19 in Feb/March 2020. In February, equity markets began to falter, while Treasuries shot higher and munis/credit held up very well. So far, so good. But then, when the bottom dropped out in March, Treasuries continued their climb while munis and credit fell apart.
The table admittedly does a poor job of expressing the situation’s real violence, as at least one credit mutual fund declined nearly 80%, and some mortgage REITs (closed-end funds) had to liquidate entirely. Excessively leveraged strategies being forced to raise cash ( to meet margin calls) on short notice resulted in a painful downward spiral, which finally – after 1000 words – brings us back to today’s main topic – marking to market.
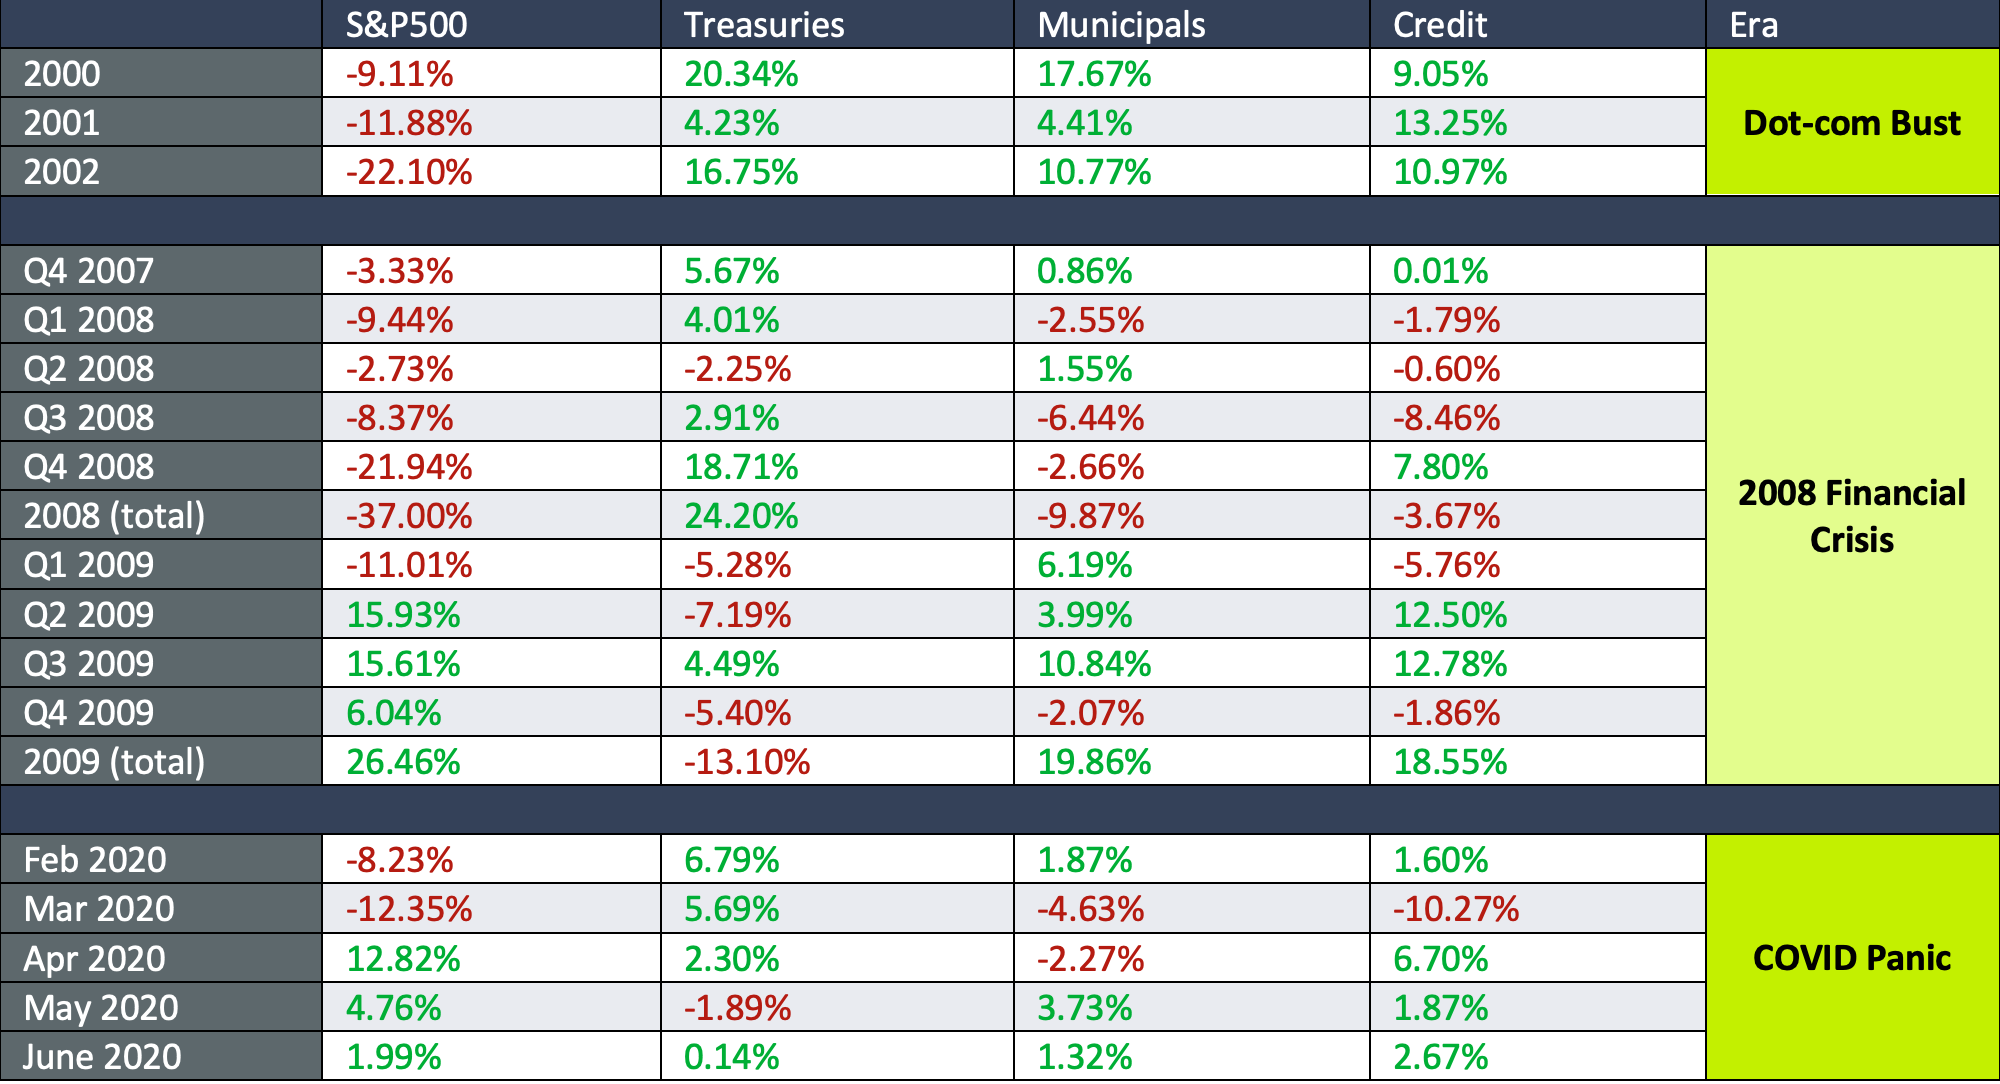 Source: Zephyr StyleADVISOR. FTSE USBIG Treasury Index, 10+ years; ICE BofA 10+ Year US Municipal Securities Index (US Unhedged); FTSE USBIG Credit Index, 10+ years.
Marking to Market
In investing, “mark to market” essentially means that your asset is worth what someone is willing to pay for it at a given time. It’s a reasonable approach, especially in normal times, but it can have pretty dire consequences during times of market stress. Given the proliferation of ETFs, and the ability for millions of investors to sell many more millions of stocks and bonds with a couple of clicks, it seems practical that this can exacerbate market volatility. Let’s play this idea out using a simple example.
Investor A decides COVID-19 will result in a panic, and he is now determined to sell his stocks during his lunch break. He sees other people must also have the same idea, as his stocks were just worth $100 this morning, but now are worth $99. He sells at the market and gets his cash, happy to get out at a slight discount.
Investor B has reached the same conclusion as investor A, albeit a little later in the day, and now accepts a lower price of $98 for his stocks.
There are many “investor As” and many “investor Bs,” and this process continues, resulting in the sellers accepting lower and lower prices, and buyers attempting to take advantage of this “selloff.” Equity markets begin to falter, while the opposite occurs in bond markets (i.e., prices rise and yields fall because of the increased demand for safer assets).
Two days later, Investor C really needs cash from her portfolio. She’s not panicking about the volatility and doesn’t want to sell her stocks – now down 10% – so she turns to other assets. She opts to sell some of her municipal-bond funds and credit funds (corporate bonds, mortgage-backed securities, etc.), thinking that local governments and companies could have more trouble ahead than the US Government. So far, the prices of these funds have remained stable, so they’re a good source for raising cash. There are many “Investor Cs” doing the same thing.
Investor D is a credit mutual fund. At the end of the day, a large amount of redemption orders are received (from Investor Cs). The fund has already sold its most liquid positions and tapped available credit lines, and it MUST sell additional underlying holdings to raise the cash. They reach out to as many bidders as possible (bonds don’t trade on an open exchange, like stocks) and accept the best prices they can get. Those prices are far lower than they were just a day before. The same has occurred at other funds and across bond markets in general. Now Investor D finds that even the bonds it didn’t sell at unattractive prices still have to be reduced to a lower value based on other trading that occured (i.e., they must be “marked to market”). After tallying the remaining holdings, the fund’s price (aka net asset value, or NAV) declines substantially. When other fundholders see the resulting price decline later that evening, they panic and redeem even more shares, thus creating a downward spiral. There are many “Investor Ds” enduring a similar experience.
Investor E is a mortgage REIT (real-estate investment trust). It is a closed-end fund, which means it trades on open exchanges, but what is in the fund stays in the fund; it doesn’t have an issue with meeting daily investor redemptions like Investor D had to do. That’s a relief! However, the fund is highly levered, holding six times as much debt as the value of its underlying mortgage bonds. This leverage magnifies returns in normal market conditions and allows the fund to pay a very high yield to investors. But – when the underlying bonds’ prices start to decline – lenders demand either more collateral for the outstanding debt or reduction of the debt (the dreaded “margin call”). With no new cash coming into the fund, it MUST sell holdings to meet its lenders’ demands and accept essentially any price to do so. Eventually, there are buyers, but prices have declined 50, 60, 70% from where they were just a few days ago. At these low prices, Investor E’s holdings can no longer support its debts. Game over. Lenders may lose money, writing off the losses and tightening their standards (for now). The floor is set, and recovery begins as bargain hunters (credit hedge funds, mutual funds, etc.) attempt to capitalize on the situation.
The part of the above death spiral that may not be obvious is that most of these bond holdings, which have just been sold at a very steep discount (e.g., for “30 cents on the dollar”), will eventually be worth a full dollar (par value) or more. Thus, we witness price dislocation in times of distress – a legitimate mismatch between the current price and long-term value of assets. If bonds are owned indirectly through one of these structures, investors are at the mercy of other investors’ whims, flows, and leverage effects. Even if one knows for sure the underlying holdings will ultimately be worth a full dollar, it doesn’t mean that a) liquid funds won’t have to sell those assets to meet redemptions, or b) a given fund will continue to exist. Either will impair the ability to recover fully.
There’s No Free Lunch
Using the above as an example, if you own the bonds directly, you can simply ride out the storm, awaiting the eventual recovery. The same is true if you own a closed-end or private structure with an amount of leverage that doesn’t result in substantial forced-selling. But, in either case, there still will be a mark-to-market effect. Portfolio holdings have to be valued in some way. In an investment account, the custodian will reflect a given bond’s discounted price based on the horrific trading outlined above. Interval funds (in mutual fund format) will mark a daily NAV that is publicly available, even though investors may only be able to buy/sell on a quarterly basis.
Instead, if you own a private credit fund that only gets valued on a quarterly basis, your experience could look like the following (it takes time to value the portfolio, so valuation is updated one month after the end of each calendar quarter – i.e., Jan 31, April 30, July 31, Oct 31).
- January 31st, 2020: you learn the Q4 2019 return of your fund was aligned with expectations. The fund pays monthly income as planned and is valued at $100 as of 12/31/2019.
- Feb 29th, 2020: receive monthly income; value still $100.
- March 31st, 2020: receive monthly income, and the value is still $100. Equity and credit markets have fallen substantially by this time. It feels good that part of your portfolio appears to be stable.
- April 30th, 2020: receive monthly income; value has been marked to $80 (down -20%) as of 3/31/2020. Equity markets have rebounded sharply, along with credit (note: not enjoyable).
- May 31st, 2020: receive monthly income and value still $80. Equities and credit have recovered even more (still unenjoyable).
- June 30th, 2020: receive monthly income; value still $80. Equities have completely recovered, and many parts of credit markets have as well. Your fund is still -20% underwater (still unenjoyable).
- July 31st, 2020: receive monthly income and the value has recovered along with credit markets, and your fund is again worth $100, as of 6/30/20. Sigh of relief.
A Quick Case Study: Private vs. Publicly-Traded
There is a particular strategy that we invest in, which provides loans to private equity transactions: when a private-equity fund buys a company, they borrow to do so more efficiently (“leveraged buyout”) with the hope of increasing returns. While our clients hold this via a private BDC (“business-development company”) structure, there is also a publicly-traded closed-end fund BDC version that has the nearly the same underlying holdings. It should be the perfect example to illustrate how an experience can vary when owning nearly the same assets in two different formats. Here’s a table comparing returns since the start of 2020 (I’ve attempted to align timeframes with inflection points of markets):
The above case is likely one of the more extreme scenarios of private vs. public returns you’ll find (merely my opinion), but I do think it’s useful, and I know which construct works better from a portfolio longevity standpoint. I’m frankly also surprised by how slow the recovery has been in this particular closed-end fund, especially given the far more pleasant experience of the private fund.
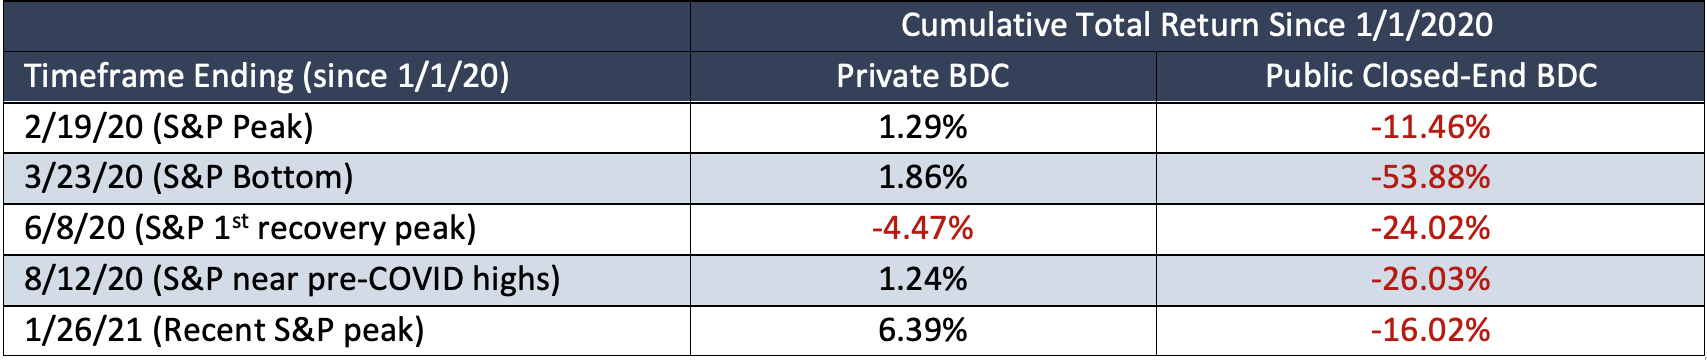 Sources: Black Diamond (client account data); FactSet
The example also brings to light the critical notion that closed-end funds can trade at discounts or premiums to the value of their underlying holdings, and these deltas can persist indefinitely. Conversely, private structures (and daily mutual funds) are systematically marked to their underlying net asset value.
Although it requires sacrificing some liquidity, private investment structures can help mitigate some effects of investor panic and market turmoil but cannot avoid them altogether. In general, the lag in valuation and intermittent reporting can help give private investors a sense of false stability during initial market volatility, but then the opposite may occur during the recovery phase. One can argue whether this is good, bad, or irrelevant, but it’s yet another example of the adage that “there’s no free lunch” when it comes to investing.
With our newly adjusted expectations – that nothing else acts like a US Treasury, and there’s no way to entirely escape the mark-to-market phenomenon – we’ll fill out our B-squad roster with investment strategies in the next edition.
Until next time, this is the end of alt.Blend.
Thanks for reading,
Steve