The big idea and why it matters: Your investment strategy doesn’t have to be cool to be effective. Higher-yielding Dividend Growth investing may be a solution for targeting both outperformance and higher income generation than the investment approach du jour (aka passive indexing).
“Over the years, I’ve often been asked for investment advice, and in the process of answering, I’ve learned a good deal about human behavior. My regular recommendation has been a low-cost S&P 500 index fund.” –Warren Buffett (GOAT Investor)
Running up that hill
I’m sure I could have found a quote for today that was against passive indexing, but why do something the easy way when you can do it the hard way (apparently, I’m not alone in this)? Mr. Buffett is regarded as one of the greatest investors in history; if we can provide reasonable grounds for disagreement with his general advice, then perhaps that will strengthen our case.
In Part 1, we set the stage for delving deeper into higher-yielding dividend growth stocks (HYDG), so we’ll continue down that path today to enhance our collective understanding. If I do this correctly, you should be left convinced of why we believe HYDG can make more sense than passive index investing as a core portfolio solution for both savers and spenders.
Reliant K
This Car and Driver headline sums it up perfectly: Remembering the K-Car: Chrysler’s Savior Gets No Respect. And if you lived through the ‘80s and early ‘90s, you’d understand why it’s hard to believe that the K-car platform is credited with saving Chrysler from financial ruin. These cars were everywhere, but generally unloved, uncool (just one person’s opinion!), and surely flying under the radar in their role as a “financial savior” of the day. K-cars played the role of extras for much more desirable cars, like Camaros, Trans Ams, Buick Grand Nationals, Mustang GT 5.0s, and Acura Integras, to weave through on the highways of America.
I won’t disrespect Dividend Growth by calling it the K-car of investing. However, with today’s hype of passive ETFs and the Mag-7, it’s not the investment vehicle (literally?) the cool kids are lining up to buy (except inside of TBG, of course). Based on some recent conversations I’ve had, the power of Dividend Growth remains elusive to institutional and professional money managers, as well as large endowments. Why? I don’t know. Like the K-car, it’s all around us, but yet not really on people’s radar.
Higher-Yielding, Not “High Yield”
A quick refresher on yield because we’re going to need a basic understanding for the next part: yield refers to the annual income as a percentage of an investment’s value. For example, if you are receiving $4 per year on the $100 stock you own, that represents a 4% yield. Given that some dividend-paying stocks and even dividend growers pay yields well below 1%, then as you get into the range of 3, 4, and 5%, this is very much in the ballpark of what I mean by “higher-yielding” Dividend Growth.
If you have the time, we have a solution.
First, as we previously established, “the numbers don’t lie.” Suppose an investor is willing to own the S&P 500 and accept a return similar to that of the index. Shouldn’t they be willing (or even eager!) to own a subset of the S&P 500 that has historically outperformed by 1.58% per year since 1958 (that’s almost 70 years)?
It’s basically a coinflip of whether or not Dividend Growth will outperform “the market” in a given year. However, that doesn’t matter for those who truly understand how it is designed to function over the long term. If you’re a saver, you may even find yourself rooting for periods of volatility (drawdowns), as lower share prices mean reinvested dividends can purchase even more shares of the underlying companies. But don’t take my word for it; let’s look at some math for additional perspective.
Combinatorics
Bringing together all of the above, let’s look at some examples of how Dividend Growth can play out over time. We don’t know the future, so we have to make some assumptions, including the starting yield, initial investment, initial share price, dividend growth rate, and share price appreciation rate. We will start with an extreme example – showing only dividend growth but no underlying share price appreciation – and then paint a more realistic picture.
We will get a little in the weeds, so bear with me, and then we’ll zoom out to make sense of it all. We’ll also use this online dividend growth calculator from MarketBeat, which you are welcome to use to model various scenarios on your own. We will ignore taxes and use annual distributions and reinvestment in these examples for simplicity. In the second and third examples, we will use a 10% total return to align with the notion that US equities have generally returned about 10% per year over the long term.
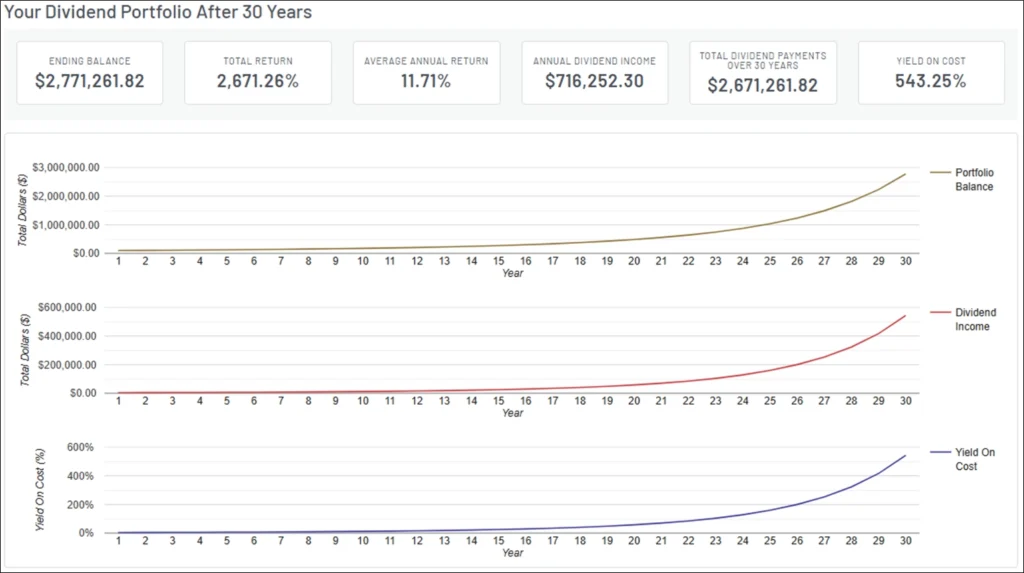
Example 1: Moderate dividend growth (6%) with no share price appreciation
Assumptions (year zero values or annual rates):
| Parameter | Value |
| Initial investment | $100,000 |
| Initial share price | $50 |
| Initial yield | 4.5% |
| Initial # of shares | 2000 |
| Initial dividend per share | $2.25 |
| Dividend Growth Rate | 6% |
| Share price appreciation rate | 0% |
Results: It’s powerful to see how exponential the income, portfolio value, and yield on cost become after about 25 years due to the compounding of shares.
- After 30 years, the portfolio generates an annual income of $716k and is valued at nearly $2.8 million.
- These outcomes are solely due to dividend growth and compounding of reinvested shares, as the share price appreciation is zero in this example.

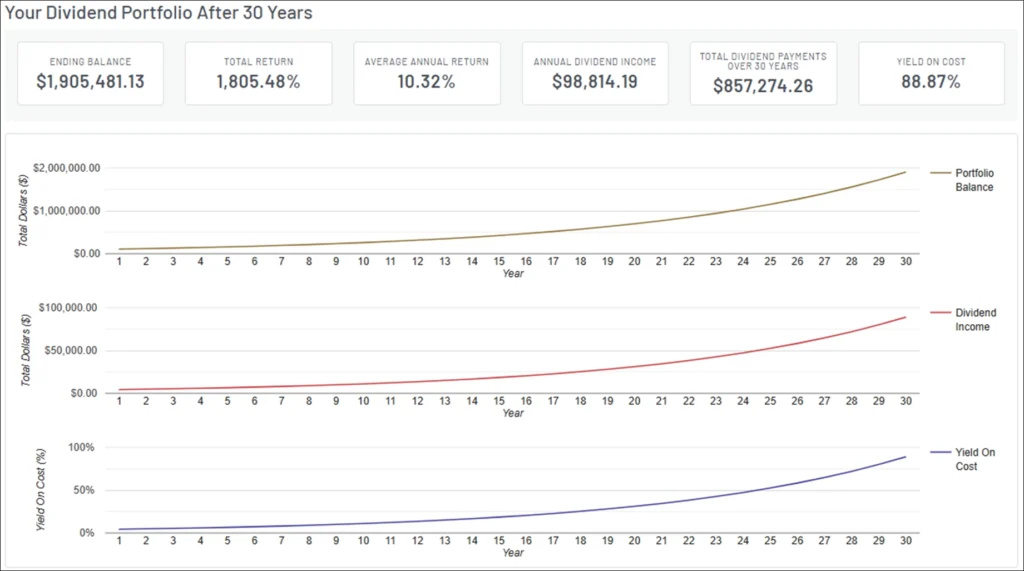
Example 2: Moderate dividend growth (6%) and moderate share price appreciation (5.5%). Total return of 10% (4.5% initial yield and 5.5% price appreciation).
Assumptions: same as above, except increasing the share price appreciation rate (from 0% to 5.5%).
| Parameter | Revised Value |
| Dividend Growth Rate | 6% |
| Share price appreciation rate | 5.5% |
Results:
- After 30 years, the portfolio generates an annual income of $98,814 and is valued at about $1.9 million.
- Note how this is somewhat counterintuitive vs. Example 1. We are using all the same parameters, except for introducing share price appreciation into the equation; this causes the shares to cost more over time, so reinvested dividends purchase fewer shares, which eventually weighs on the compounding of those shares.

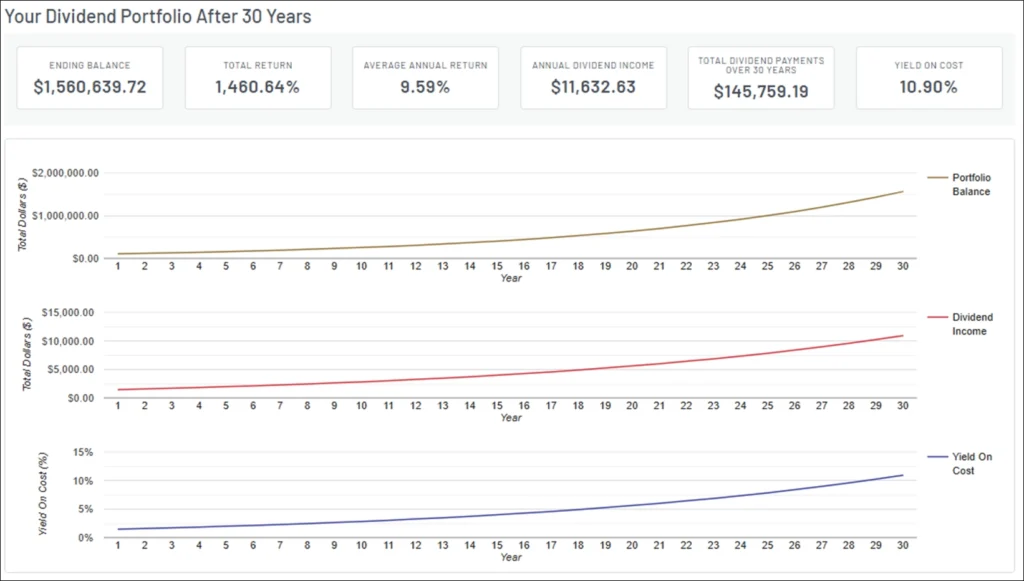
Example 3: Low initial yield (1.5%), moderate dividend growth (6%), and higher share price appreciation. Total return of 10% (1.5% initial yield and 8.5% price appreciation).
Assumptions: same as above, except lowering the initial yield (from 4.5% to 1.5%) and increasing the price appreciation (from 5.5% to 8.5%), which is more representative of a US Equity index investment. [Per FactSet, the dividend yield on a broadly used S&P 500 Index ETF is 1.21%, so 1.5% is currently somewhat generous.]
Results:
- After 30 years, the portfolio generates an annual income of only $11,632 and is valued at about $1.56 million.
- Note how much a lower initial yield and greater price appreciation affect the future income and portfolio value vs. the previous examples.

This edition is already too long, so I’ll leave you to mull over the above results and consider whether we may have grounds to disagree with the Oracle of Omaha. We can then use the next Alt Blend for further interpretation, takeaways, and to explore where “passive” may really make sense.
Until next time, this is the end of alt.Blend.
Thanks for reading,
Steve


