Dear Valued Clients and Friends,
Thursday’s market drop did not stress me out. There is a reason why I am telling you this.
1,800 points came off the Dow in one day, the fourth worst day of the year by the way, and while I spent significant time unpacking it, studying it, and understanding it, I did not spend any time “sweating” it. As you will see in the content of this week’s Dividend Cafe, I believe there is very little evidence of health-related issues at this time to drive markets lower (i.e. so-called “second wave” rhetoric). But more importantly, the “stock market” volatility and drama was unaccompanied by the things that really, really mean distress – blown-out credit spreads, illiquid bond markets, frozen mortgage instruments, overseas panic, and all the broad risk-off “stuff” we often see. This was really about the stock market, and it was the stock market doing what it does.
No doubt, there were weak hands shaken out this week. And no doubt, equities were in need of a little adjustment (“too far, too fast” was at play). But I did not have clients calling wondering what they should do. The market was down 1,800 points in one day, and no client called, emailed, or texted me directly to express fear and trepidation. Granted, markets had been up 2,500 points just nine market days earlier … But I believe it was more than that.
I believe we have done a pretty good job communicating a reality to clients that far too many advisors avoid articulating: That markets go up and down, sometimes a lot, and sometimes without any strand of predictability or sense. I believe that in the short-term, people know that markets are going to bounce around as the economy finds its footing and we deal with these ongoing uncertainties. And I further believe that longer-term, people know the events of a particular day in June 2020 are not material to the ultimate destiny of their financial performance and objectives.
The things I read in the media every day (sensationalized fiction about so many things) and see in the data every day (spikes in day-trading speculating on bankrupt companies) make me very grateful for the business we have. I am proud of our process, and I am grateful for the clients for whom we execute it. That is why the market did not stress me out this week – our process, and our clients.
So click on in to the Dividend Cafe … We will be unpacking so much of that process, and applying our beliefs and principles to the latest from the Fed, the realities of a bull and bear market, where economic pressures lie, and even the state of the 2020 Presidential race. Analysis and application – to that end, we work.
Market redux
The Dividend Cafe is all over the place this week, covering the big picture topics I believe are most important. But just as I was ready to de-couple the Dividend Cafe from the “here & now” of the markets (and particularly from the latest COVID drama of the week), the market dropped 2,000 points through Thursday, with 1,800 points coming in one day. Naturally, readers may want some sort of current market diagnosis.
Markets were all over the place on Friday, closing +500 points and retracing some of the downside from the week, yet still leaving markets down ~1,500 points on the week. Friday’s story was actually more far adventurous than that, going up 800 points at the open, then later in the day going all the way to negative territory, then rallying back +500, with all sorts of zigs and zags in between. The following represents my best take on the reasons behind the downside move in markets up until Friday (yes, in order) …
(1) I do believe the biggest factor is simply the blow-off of steam from what had built up in markets the two weeks prior. There was some level of froth that was bound to consolidate. Why do I believe this is specific to equity market build-up, and not a sign of deeper issues is the economy, COVID, and overall risk? Well, on a day that equity markets dropped 1,800 points, we saw non-agency mortgages actually increase in price, we saw structured credit spreads tighten, we saw the Nikkei close 500 points higher than its low of the day, we did not see real impairment in traded loans or syndications, and we saw futures rally rather than pile on the sell-off. A more comprehensive risk-off rally is simply not compatible with all of that. No, I believe this was a timely adjustment to stocks specifically following a big run-up …
(2) Consider this more of an elaboration of point #1 – but there was a shakeout of day traders, and more so, CTA’s … (if you don’t know, CTA’s are Commodity Trading Advisors who largely trade futures contracts on momentum signals).
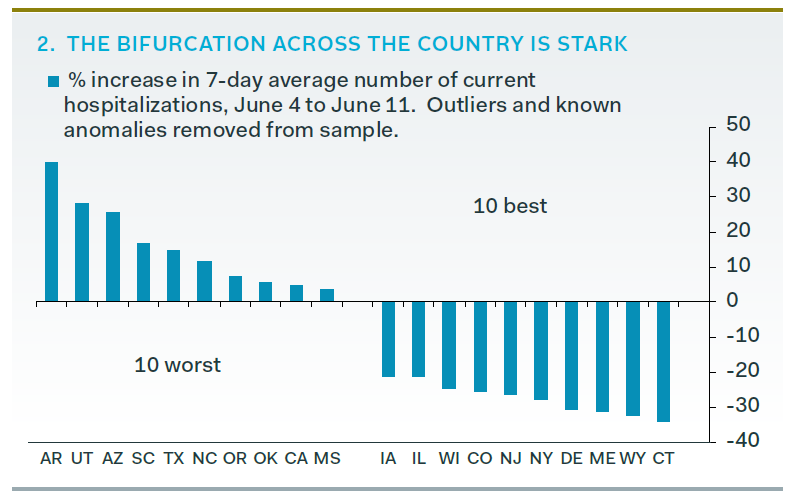
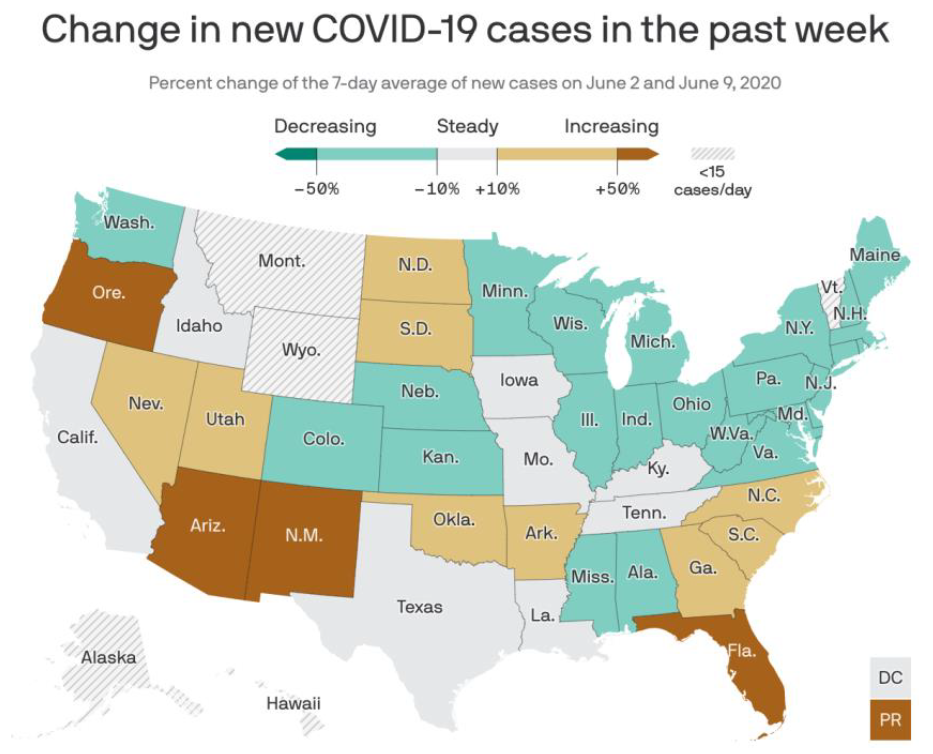
(3) The headline risk around COVID’s “second wave” … I do not believe the market is selling off because of the actual health data, but I do accept that the market may have partially been spooked by some of the media coverage of it all, and a general paranoia that a new narrative may form. The reason the data itself doesn’t pass muster as a real explanation is it simply doesn’t speak to anything market-sensitive. First of all, consider the clearly split nature of post-opening realities:
* Pantheon Macroeconomics, June 12, 2020, p. 1
Second, within Florida and Texas and other areas believed to be problematic, markets are well aware that the following are all at play – (1) A concentrated outbreak in one neighborhood – not a systemic economic event; (2) Parabolic testing increases with no meaningful increase in positive case percentage; (3) A 98%+ recovery rate in Texas; (4) Massive medical resource capacity in the states that have seen modest increases; (5) No meaningful change in the fatality moving average
* Macro Scan, June 12, 2020, p. 3
(4) Finally, it’s not out of the question that the subject of the Politics & Money section (below) plays in to market pressures as well this week.
Let’s be very clear about bear and bull markets
The great bull market of the last decade didn’t begin in March 2009. It began in February of 2013 if you believe a “bull market” starts when it regains its past high level. The market was up 100% from March of 2009 to February 2013, yet only in February of 2013 did it re-touch its high from October 2007. Now, if you want to start the bull market and its low in March 2009 that is fine, because this is all random, arbitrary nonsense, so you can make up whatever you want. But the universal description of a bear market is a drop of 20%. Well, we had that in both October 2011 and December 2018, unless you believe that a price hit in the middle of a day doesn’t count, whereas a price at the end of the day, for exactly one day, does count. In that case, we were only down 19.8%, so that wouldn’t count. Unless you believe rounding counts, in which case it does count.
So here is the thing – the market has gone down three times since March of 2009 by 20% or more. The last one was the COVID collapse of March 2020, and it was a doozy, both for its magnitude (-36.7%) and more so the speed (33 days). You can say the bull market began March 23 (at the bottom of 18,213 intra-day), or you can say it began at the end of the day (closing 18,592), or you can say it began March 26 (when we were up > 20% from the bottom, having closed at 22,552). Or you can say it won’t begin until we re-touch the February 12 high of 29,500 (though that would put other indices there now).
Is this all clear as mud?
Bear markets and bull markets are like other things I won’t mention – you know them when you see them. The gymnastics people go through to define what is definable should be of no interest to you. The great run of March 2009 through March 2020 saw two other periods of ~20% decline, and it saw over 50 periods of 2-10% declines. And it also featured hundreds of emails along the way sent to me wondering what to do about how high markets were. THAT is the real takeaway – when things are good, human nature can get nervous. When things are bad, human nature can get nervous. This is the life I chose. But my job is to manage for continually escalating dividend growth through good times and bad, and to manage client emotions and behavior along the way.
Call it a bear market or a bull market, but no matter what we will call it our calling. To that end we work.
And besides …
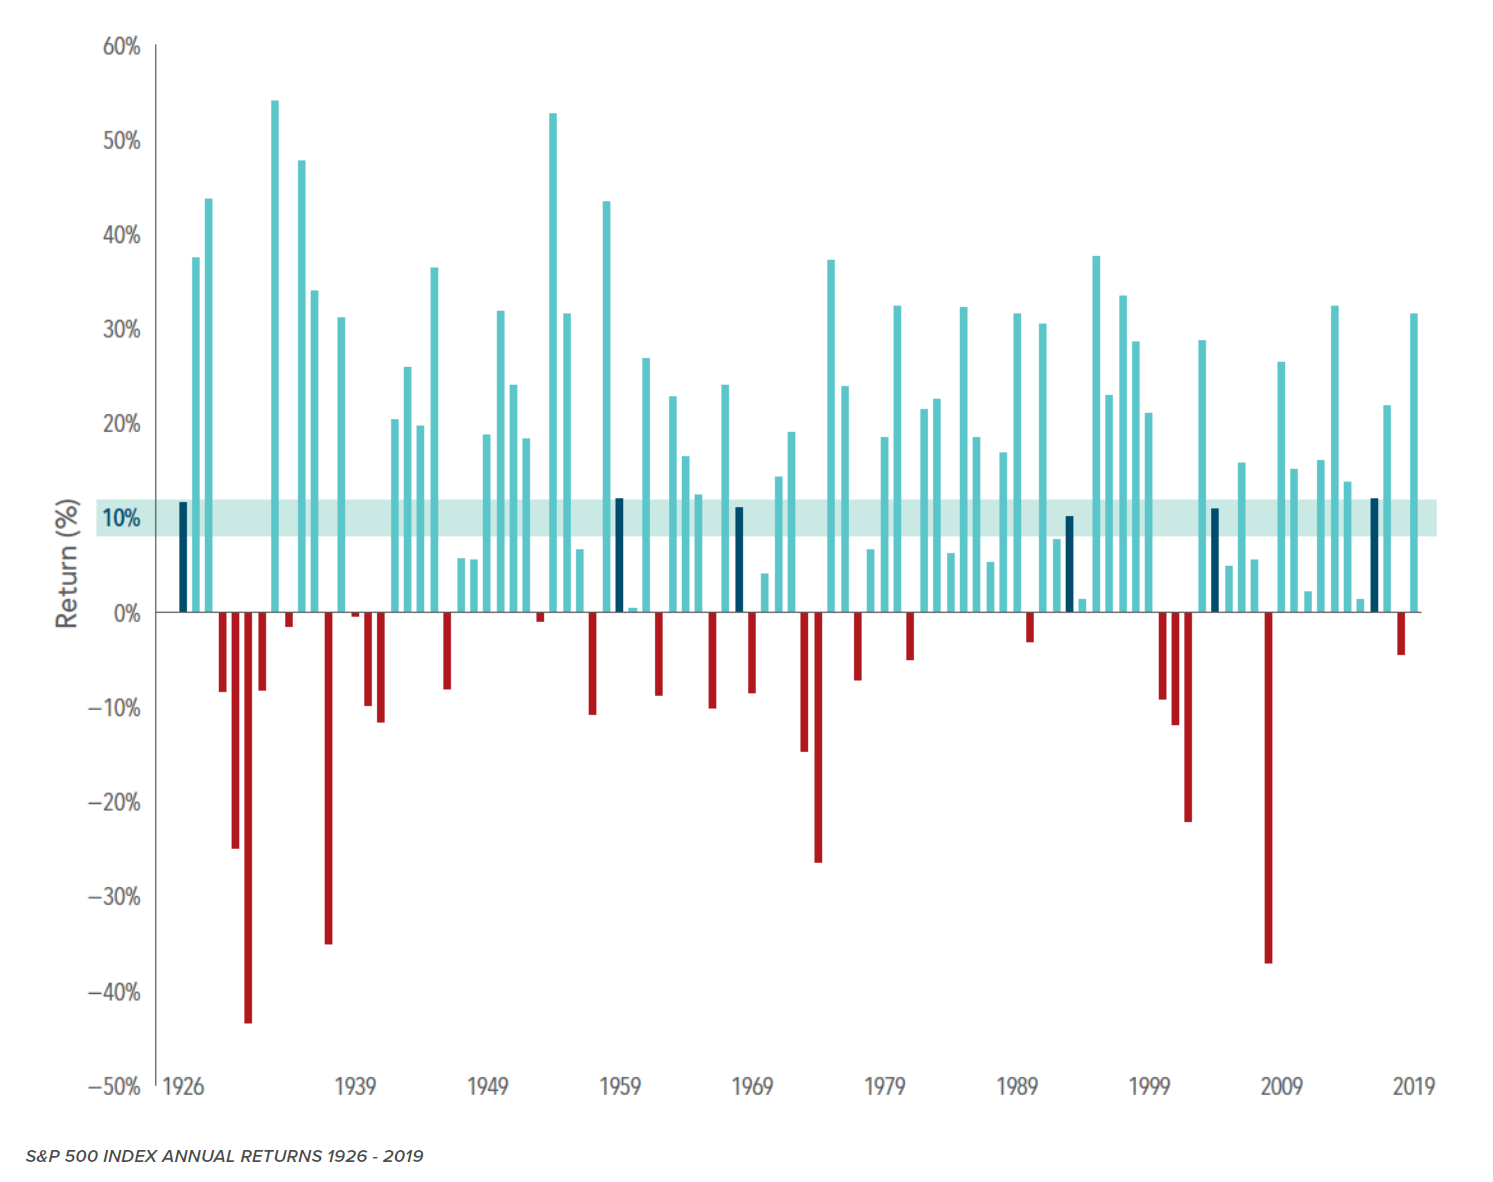
You may not be interested in these semantic conversations about bull and bear markets, because you know that the market has averaged ~10% per year, and that is all you care about. Fair enough. Now re-word the sentence and say, “the market should do 10% per year.” Now we have to talk. They may seem like similar sentences, but please understand: The average annual return of ~10% people love to talk about has been hit – never – in a given year. Now try this one on – the market has been from 8-12% (plus two and minus two around that 10% average) just six times in 94 years. Yep. We’ve been up 50%. We’ve been down over 40%. We’ve been down 25 out of 94 years and up 69 out of 94 years (73% of the years up vs. 27% of the years down). So does “10% on average” sound right to you, when it basically never happens? The way one gets to an average matters a lot, at least to the person not waiting for their 94-year average over time to look.
* Dimensional Fund Advisors, May 15, 2020
How to think about jobs and the economy
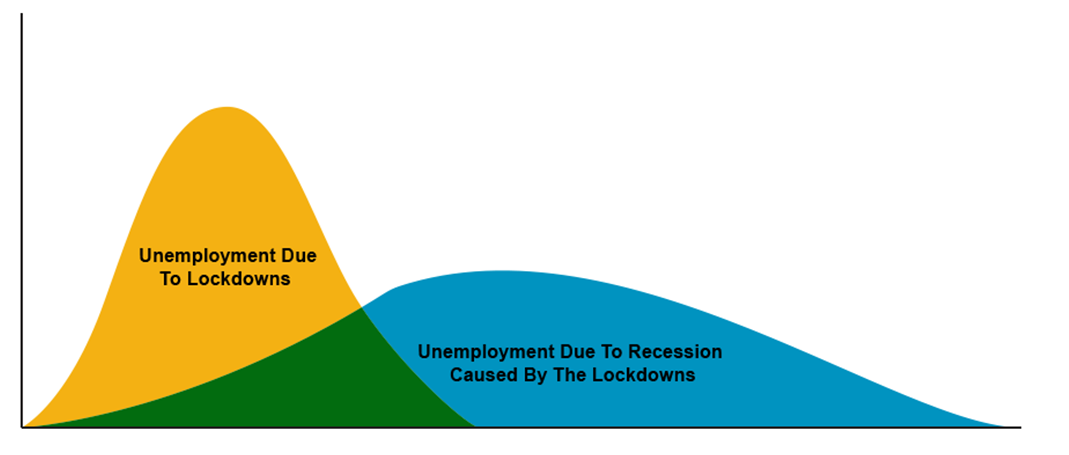
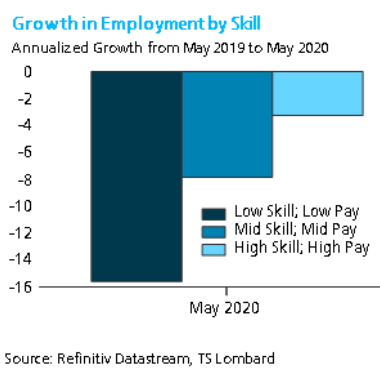
I think this following two-curve chart from Bloomberg helps to capture both where economists missed the mark last week (the highly temporary nature of so many job losses from the COVID lockdowns), and then the ongoing challenge and uncertainty the economy faces (job losses not so much from the lockdown, but from the recessionary aftermath of the lockdown – all of which is uncertain in its scope and dynamics both in the present and future).
* Bloomberg, Five Things, June 8, 2020
The risk would be that one hand giveth (many temporary job losses are, indeed, restored) but the other hand taketh (as permanent job losses increase above expectations). Even for an optimist like myself I see this as a distinct possibility, as corporations wrestle with the reality of margin compression and the ability to maintain productivity with lesser unit labor costs. So the potential dynamic I am describing here is that the area of job vulnerability we have been most focused on thus far in COVID (hourly workers, uniformed workers, leisure, hospitality, retail outperform expectations, but the aftermath results in higher structural unemployment for white collar workers. It is too clouded with unknowns to forecast, but it bears watching.
A blast from the past
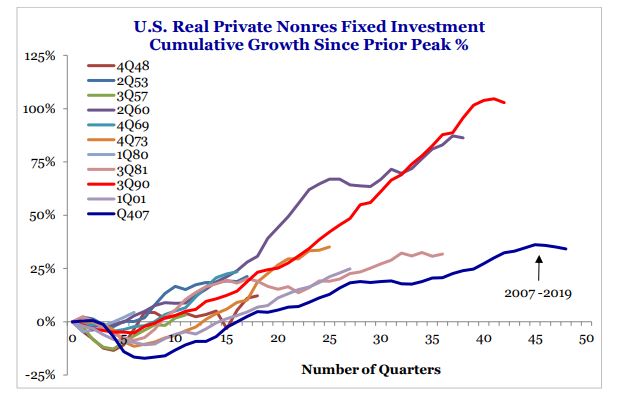
Remember my old friend, Capex? In a pre-COVID world, it was the macroeconomic subject I most believed would impact the extension of economic expansion or the cessation of such. Business investment was the lacking element of economic growth post-crisis, and it was capex that drove a higher economic growth in 2017 and 2018. The trade war cut into it in 2019 but our forecast was that 2020 would see a rebound in capex in light of the phase-one China trade deal. Obviously, the COVID period has pummeled CAPEX expectations, and how this will pick back up, and when, and in what aspect of capex, remains to be seen.
That fixed investment/business spending never picked up much out of the last recession (i.e. the financial crisis).
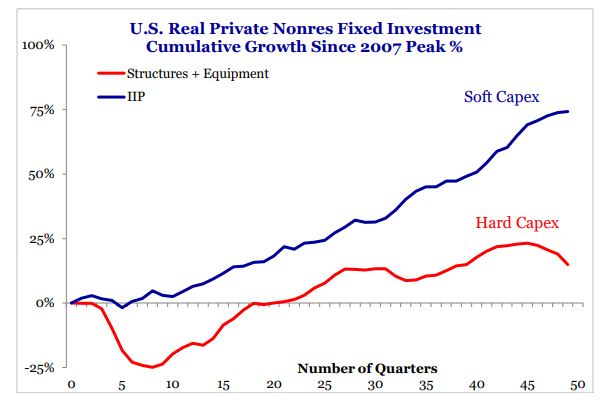
And where it did, it was much more with intellectual property and R&D than it was manufacturing and property.
* Strategas Research, Economics Report, June 8, 2020, p. 4
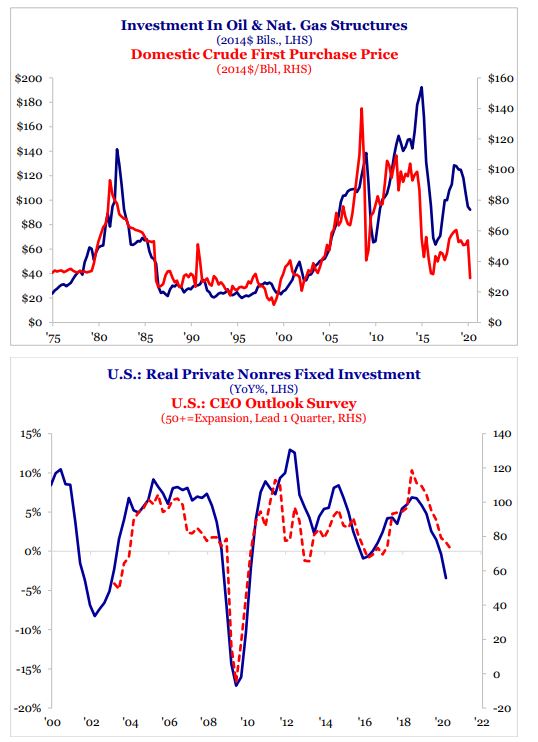
Ultimately, I believe the two biggest things needed to re-ignite the U.S. renaissance in capital expenditures are (1) Investment in our energy infrastructure, and (2) Business confidence. Both have dropped, obviously, in this COVID moment. Where those two pieces go will determine where capex goes, and where capex goes, so goes the next couple years of the economy after the COVID recovery runs its course.
* Strategas Research, Economics Report, June 8, 2020, p. 5
Fed watch
I wanted to more thoroughly unpack the FOMC meeting from Wednesday yesterday but got hijacked by the market drop … A few tidbits on where we stand with the commanders-in-chief of the U.S. economy Federal Reserve:
- So yes, they are targeting the zero-bound for two and a half more years (end of 2022). That is actually longer than I expected them to admit, and less than I think will actually end up being …
- Much of their reasoning for various extraordinary policy measures did not center around the usual “stability of financial markets” lane, but rather had heavy context around “avoiding long-term damage to the economy.” In other words, they seem to have gone from the short-term argumentation of March to a longer-term argumentation now.
- The Fed’s own projections are that they will be raising rates at the end of 2022, yet inflation will be below their 2% target, and unemployment will be above their 3-4% target. So something is off here, right?
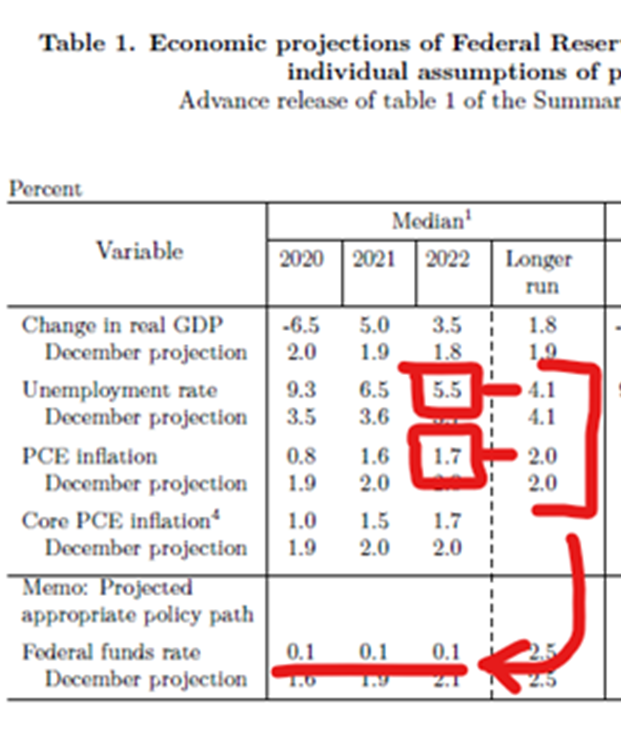
* Federal Open Market Committee, June 10, 2020
- Powell clearly is pushing for an extension of fiscal support and relief programs (not just generic Keynesian “stimulus” – though that, too; specifically, he seems focused on extension of targeted laborer support, UI, etc.)
- It spoke loudly to me that he was utterly and completely silent about the recent violent rebound in energy prices. If the Fed wanted an excuse to claim inflationary concerns were holding them back from further accommodation, it would be hard to imagine a better one than oil prices jumping over 100% in a month. But, it was not even mentioned in passing, let alone as an inflationary signal. I see this as a sign that Powell wants to make it very clear they do not have an iota of concern about inflation right now.
- With $80bn of pickup in Treasuries and $40bn in Mortgages ($120bn/month), this will bring their balance sheet to $9 trillion by the end of next year.
- I am now wondering if they will extend Yield Curve Control beyond three years when (and if?) they implement it. My sources tell me it is being hotly debated right now, and I do know two Fed governors who are tying their interest in support to yield pegs to limiting the maturities. So we may not be debating “YCC or no YCC” any longer, but “what maturities to peg” (Churchill reportedly called it “haggling over price”).
- It sure seems to me asset allocators ought to take note of how dismissive Powell is about worries that Fed policy is boosting up asset prices. The P/E floor of the S&P has gone generationally higher. Could they pull the rug out from under risk takers? I suppose so. But their signaling well into 2021 … all systems go.
China watch
Remember two weeks ago when the media was reporting that China had cancelled agricultural import orders? Well, one million tons of soybeans were bought last week alone (source: USDA)
An escalation between now and the election remains a possible disruption to markets, but I still think the odds are that such is postponed until after the election. One very trustworthy source of mine believes it will be after the convention, but before the election.
Sharing “privately”
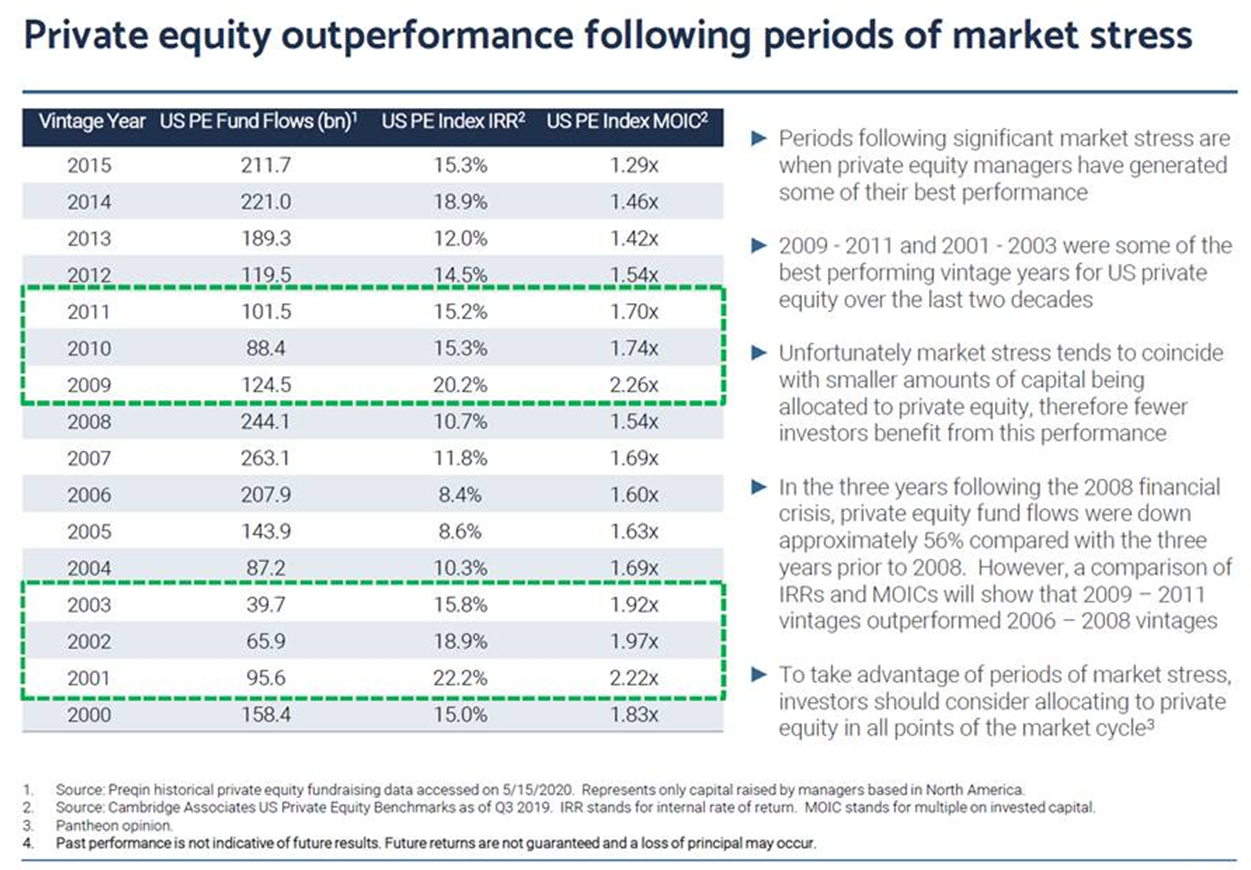
I am not going to let my theme of “illiquids” get away from me, no matter how much interest there is in public equity and bond markets … The chart below illustrates a fascinating historical trend when it comes to private equity – inflows and interest tend to be lighter coming out of distress periods, even though those are the periods from which their greatest forward returns are generated.
Initial jobless claims and the stock market
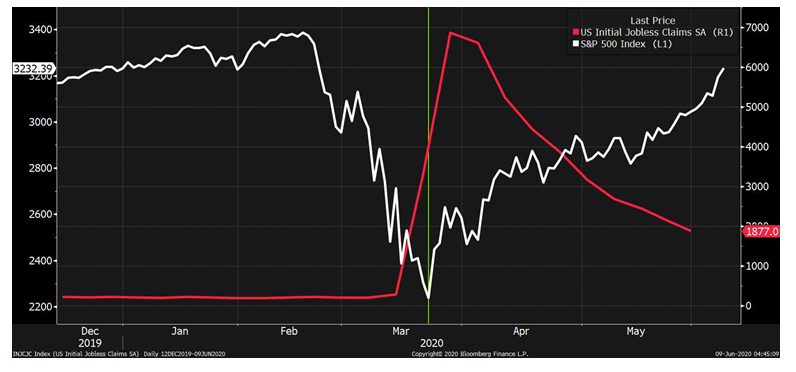
I thought these charts from Bloomberg were quite interesting in seeing the correlations over time between weekly jobless claims and the stock market (more specifically, the trajectory of initial jobless claims. Here we see the stock market in the last few months (white line), up against the red line of exploding jobless claims when the economy was first shut down. Slowly but surely the week over week claims came way down, and the market recovery began:
Note how this trend played out in the financial crisis as well:
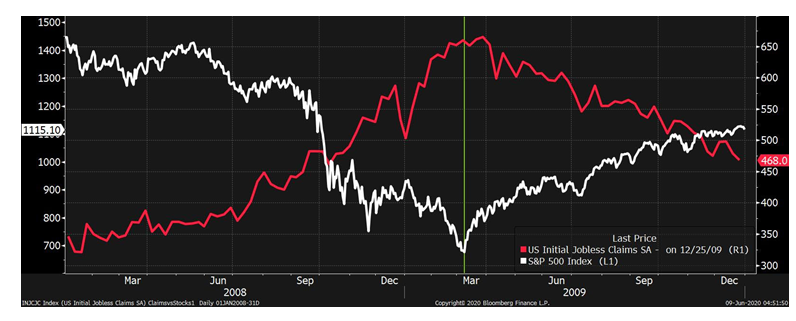
And from a longer term horizon, the inverse correlation becomes really clear:
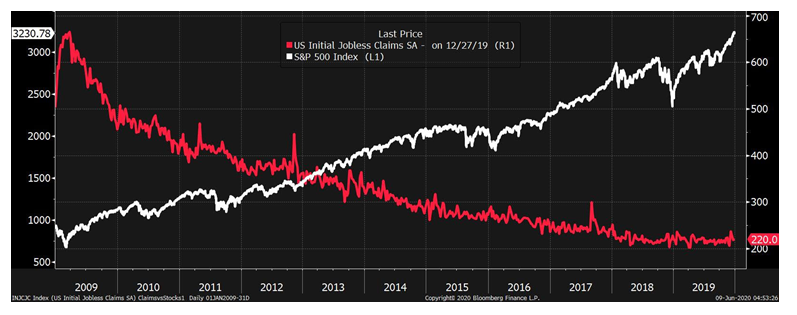
* All three charts: Bloomberg, June 9, 2020
Politics & Money: Beltway Bulls and Bears
- I more and more think the election results are likely to be “wave” oriented in November, not because I am predicting that there will be a Democratic “wave” that delivers them the White House and the Senate, but rather because I am predicting the outcome will either be that, or a Republican presidential re-election along with a House takeover. In other words, while I have no idea which way it will go, I can see a scenario where divided government is out and some wave – one way or the other – prevails on election night.
- That said, at least for now, challenger Biden is pulling away in the betting odds a bit … This will likely be up and down in the months to come, but because I showed last week’s chart where the two numbers were quite close I thought an update reflecting this spread was appropriate.
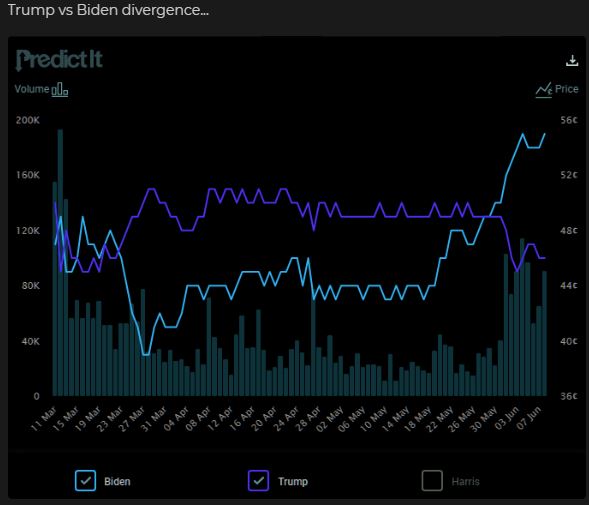
*PredictIt, The Market Ear, June 9, 2020
Chart of the Week
The total liquidity of public market companies is now at generational highs in the S&P, and nearly decade highs for small cap companies. Solvency fears of a few months ago have taken a backseat to questions about excess liquidity and optimal deployment of cash.
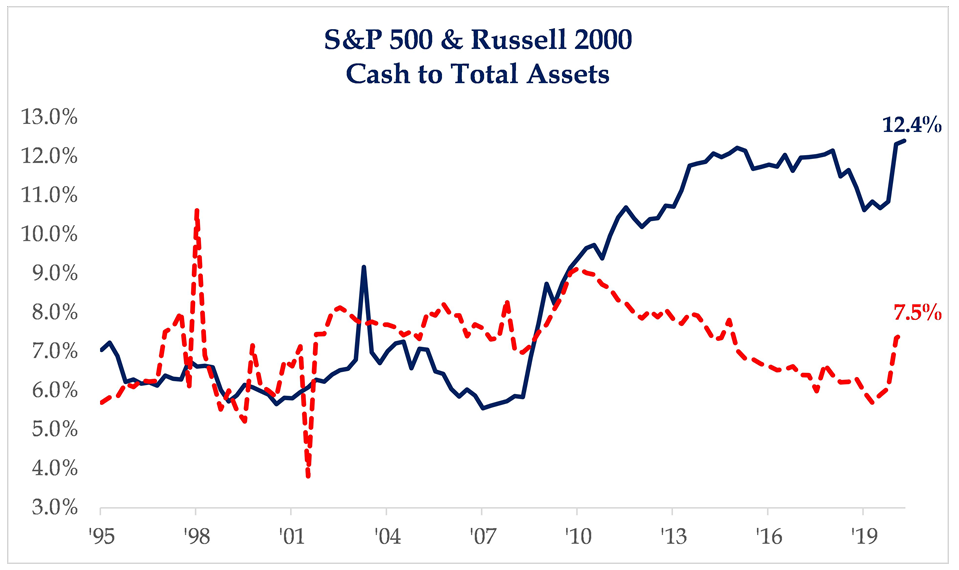
* Strategas Research, Daily Macro Brief, June 10, 2020
Quote of the Week
“No amount of sophistication is going to allay the fact that all of your knowledge is about the past and all your decisions are about the future.”
~ Ian Wilson
* * *
Another crazy week in the markets comes to an end, and I realize that my printed and digital pile of research headed into the weekend is literally 1,000+ pages in aggregate. I will probably start to read the second I hit “send” on this week’s commentary. It is hard to avoid information overload right now, but I prefer that to information apathy (the defining condition of so much of the financial advisory profession).
Enjoy your weekends, and please reach out to your advisor if you have any questions whatsoever. We are here and ready.
With regards,
David L. Bahnsen
Chief Investment Officer, Managing Partner
The Bahnsen Group
www.thebahnsengroup.com
This week’s Dividend Cafe features research from S&P, Baird, Barclays, Goldman Sachs, and the IRN research platform of FactSet


