Dear Valued Clients and Friends,
The Dow had its worst day in 14 months yesterday, on one hand, bringing markets down a thousand points from where they were last Friday (this is being written pre-market on Friday, so I can’t speak for what market action Friday does to the final tally). On the other hand, it brought prices down to where they were … wait for it … two whopping weeks ago! Yep, markets were near 40,000 at the end of March, then 38,000 at the end of April, then 39,000 a week later, then 40,000 another week later, then back to 39,000 another week later. Lots of up and down movement. But markets are where they were at the beginning of … February.
Traders are getting creamed. Investors are watching the NBA playoffs. And serene people don’t even know there is a Presidential election in five months. That’s at least my assessment of the lay of the land.
In the Dividend Cafe today, we look at the “wisdom” of the crowd, diversification properly understood, inflation and the long bond, emerging markets, active management, and contrary behavior.
|
Subscribe on |
Get used to this
One day in the market means nothing to anyone. One week in the market means nothing to anyone. One month in the market means nothing to anyone. But that ought to cut both ways. I find it unfathomable that anyone would get concerned after a bad week, but I also find it unfathomable that a bunch of people would become optimistic after a good week or two. What I do not find remotely surprising, though, is a headline like this:
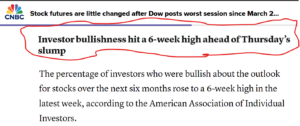
*CNBC.com, May 23, 2024
Di-versification or Di-worsification?
There are several things to be said about diversification. One is that it is a very, very good idea in a portfolio. The other is that it is often done quite sub-optimally. Another thing that should be said is that diversification is not merely “owning a lot of things.” Owning ten big tech stocks as an entire portfolio does not become “diversified” by owning thirty big tech stocks. Likewise, owning two hundred stocks does not become more diversified with five hundred (say, in an index fund). Owning ten indices that are all tracking about the same thing is the textbook definition of a diminished utility. Owning ten funds with a correlation of 0.9 or higher to one another, or ten managers, or what have you, is NOT diversification.
So, if it is not merely piling on the volume of managers, indexes, or positions, what is diversification?
First, let’s get our terms straight:
Asset Allocation is the process of diversifying across broad asset classes. Ideally, that asset allocation actually diversifies only when Asset Class A (let’s call it Dividend Growth equities) has a low correlation to Asset Class B (let’s call it Alternatives). A high correlation across asset classes is doubling up an exposure – it is not diversifying it. Asset Allocation is diversification by category.
Diversification can be said to be the counter to the risk of “all eggs in one basket” within a given asset class. In other words, we own 2-3 dozen dividend growth stocks because if one name faces a particular downside surprise, it won’t kill the whole portfolio. But if the entire market is hit, we don’t see having 2-3 dozen stocks as diversifying that away. Market risk is systematic (geopolitical, economic, interest rate, sentiment/psychology), and it can’t be diversified away. But non-systematic risks are what diversification is for (a CEO getting in a car accident, a natural disaster taking a plant or factory off line).
So, at the end of the day, di-versification avoids di-worsification when:
- Asset allocation is used to manage systematic risk (across asset classes)
- Diversification is used to manage non-systematic risk (inside asset classes)
- A mere volume of positions or managers is not the focus
- Conviction is not replaced by quantity
Finding Value
Emerging Markets equities are up +7% year-to-date as an index, the strategy we are married to is up +10% year-to-date, and yet, emerging markets as an asset class are at a 50-year low relative to U.S. equities. This speaks to the valuation in U.S. equities but also the valuation in EM (hence the word, “relative,” which by definition involves two things). The price relationship between the two is now off by one whole standard deviation. The last time this happened, the surge back was, shall we say, monumental (2000-2007).
If this is dead then kill me
Actively managed ETFs represented just $100 billion of U.S. assets in 2020, as the rage in the decade of QE and ZIRP that followed the financial crisis was “cheap beta” and passive indexing. The size of the actively managed ETF space in the U.S. now (four years later) is over $600 billion. Reports of active management’s death were greatly exaggerated, even in the very space that existed for passive management.
Speaking of the crowds
From 2020 until early 2022, leveraged ETFs (bought almost exclusively by retail investors) exploded in size from less than $500 million to over $6 billion. In 2022 as the shiny object craze got taken to the woodshed, leveraged ETF purchases dropped from over $6 billion to about $1.5 billion. Now, here in 2024, the purchases have exploded back up very close to $6 billion yet again. I don’t have anything to say about leveraged ETFs, per se; I merely point out the indicator of sentiment their flows represent and the contrary indicator at play.
Risk by any other name
High yield credit spreads – 3%
VIX – going between 12 and 13
Puts (out-of-the-money) – lowest cost in over a year
What are all these indicators? A price of risk mitigation (i.e., the yield one demands for riskier credit, the cost of protecting against an S&P 500 decline, the cost of tail risk hedges) – and all of them have been hitting very low levels the last couple of weeks.
Bahnsen Law #35: Complacency is not a sign of good times to come.
Energized
Natural gas prices started the year at $2.40 and went to $1.58. They are currently at $2.84. In other words, 30-40% drops followed by +75% increases. And that is sometimes within a few weeks of one another. What can we take away from this as energy investors?
Well, for one, trading on the day-to-day and week-to-week moves of natural gas prices does make equity day-trading the second dumbest thing one can do (out of those two options, I can think of dumber things in the whole universe, I suppose). But if one’s investment thesis is buying into the cash flows of pipelines that transport natural gas, and we see weeks where natty gas is up +16% (last week), yet pipelines are up +1.5%, or we see months where natural gas is down -30% (January), but pipelines are up +3%, we have the information we need to understand that a commodity price thesis, let alone a commodity price volatility thesis, and an operational infrastructure thesis, are not the same thing. We are focused on the latter, not the former, and for good reason.
Past is prologue
As a general rule, the sequence of whole markets getting rich, with euphoria getting excessive, with whole markets fading, while that which has led the euphoria (the hottest dot in the mix) NOT fading but actually expanding, THEN followed by that which led the way up then reverting to the mean, is not abnormal. It is actually very, very normal. “The market looks expensive; I think I will hide in the relative safety of artificial intelligence stocks …” is only a comically hilarious thing to hear if you forget the ideas of “the market looks expensive; I think I will hide in the relative safety of biotech stocks” (or “work from home stocks” or “dotcom stocks” or “housing stocks” or anything else). The basic human instinct that supposes the thing that just got done doing best is the safest thing (as opposed to the opposite) is both basic and human, and it is also self-correcting through time.
A Contrary Closing
What does one do with a Dividend Cafe filled with messages about diversifying so as to not diworsify, all the while seeing oodles of indications that crowd madness is headed in the wrong direction? Well, they are to combine the lessons all together, of course. “Risky asset flows” are skyrocketing, while defensive flows are net negative. It is a dream scenario for investors like us – vastly better fundamentals coupled with anti-faddishness. When the crowd is against you and the fundamentals are for you, then you have what can be reasonably called a “buying opportunity.” Meme stocks, high priced mega-cap growth, levered this and levered that – there is no shortage of shiny shinies out there. But through it all, there remains the gift that keeps on giving. Cash flow. Real companies. Normal valuations. And actual businesses run by humans in the service of other humans.
It is so conventional that it can only be considered contrary in a bizarro land. Well, take a look around or watch the news sometime. We are in bizarro land now.
Chart of the Week
I have stated for a long time – the long bond yield ought to be equal to the nominal GDP growth of the economy. But a more important thing to say is that it will always end up getting there, eventually. Always. So, it is both a prescriptive and descriptive statement. The structural growth of the economy and the 10-year bond yield become the same over time.
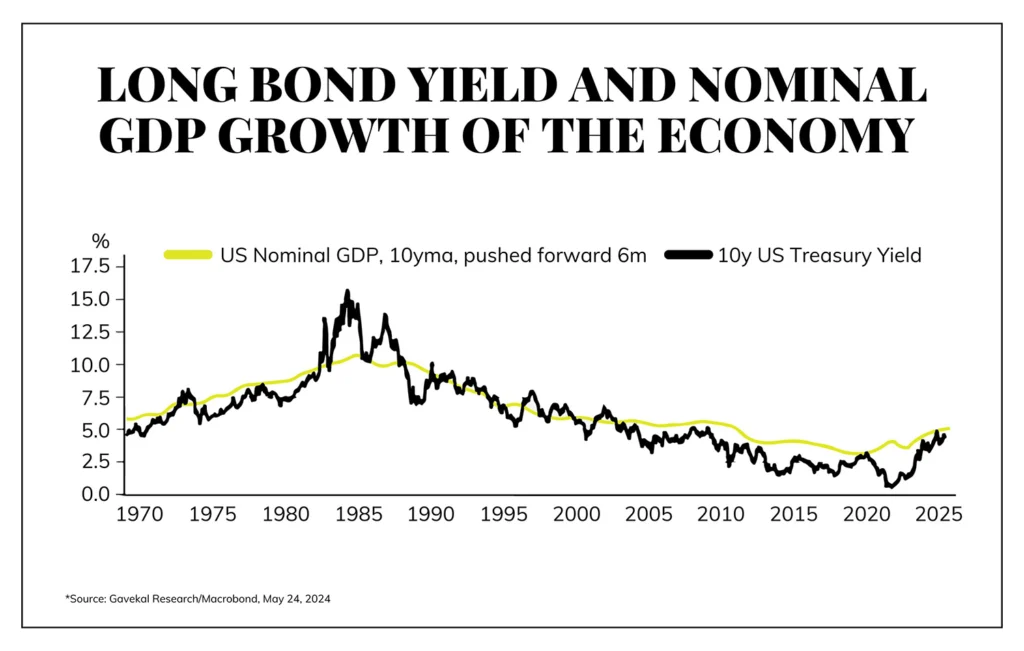
However, the “nominal GDP growth” of an economy is not enough information to fully inform an investment view. The composition of nominal growth (i.e., inflation plus real growth) matters. How can two nominal GDP numbers, both 4%, be totally different from one another? Well, 1% inflation and 3% real GDP growth is one thing, and 3% inflation and 1% real GDP growth is another. And, of course, 3% nominal GDP growth and 6% nominal GDP growth are two different things, too.
In the midst of the most significant monetary tightening in the United States since the early 1980’s, the 10-year has managed to get up to 5% (which it held for about five minutes), and basically sat between 4% and 4.5% ever since (with a fed funds short rate above 5%).
The bond market may be wrong, in which case rates will have to be higher (see above). But for my money and fifty years of history (actually much more than that reflected on the chart), I would suggest that something around 2% growth with 2% inflation is what to expect. And when the fed funds rate comes down and term premium is properly measured, we may be saying 4% is optimistic.
Quote of the Week
“The loudest one in the room, is the weakest one in the room.”
~ Frank Lucas
* * *
I am already excited for next week’s Dividend Cafe – a special 50-year retrospective, not of my life, but of markets throughout my life. It will be worth the wait. Happy Memorial Day, all. Thank you for making this writing so worthwhile to me.
With regards,
David L. Bahnsen
Chief Investment Officer, Managing Partner
The Bahnsen Group
thebahnsengroup.com
This week’s Dividend Cafe features research from S&P, Baird, Barclays, Goldman Sachs, and the IRN research platform of FactSet