Dear Valued Clients and Friends,
I do something a little different in this week’s Dividend Cafe – I cover three topics and pretty separate ones from one another at that. In my mind, they are all connected – but lots of things are connected in my mind that may not make sense to others.
In this case, I see them as distinct topics yet connected in the sense that they all are part of our investment worldview at The Bahnsen Group. The challenges to dividend growth in index investing, the particulars around the Energy sector in 2021, and the inconvenient truths about bitcoin – these are three separate topics, but they are all topics we have thoroughly developed beliefs about, beliefs that are an off-shoot of our foundation.
And we dive into some COVID stuff that is alone worth the price of admission – chart-filled and everything!
So view it as one topic with over-arching connectivity, or a three separate topic week, but either way, this is a Dividend Cafe you will be glad you read.
A trend that has to be avoided
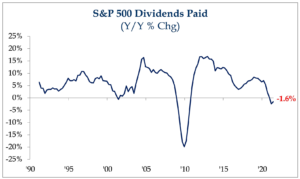
At the core of a dividend, growth philosophy is, well, dividend growth. It is one thing to have a very subpar income flow from market indices (the S&P 500 ETF yield is 1.27% right now, one-third of its historical average, and basically the same paltry yield as the ten-year treasury bond), but it is another altogether to have a negative income year-over-year, as has now happened with the broad market index.
How does this happen, especially in a 12-month period where the total market performance has been quite strong? It is a by-product of having to mix some dividend growers, some ambivalent dividend payers, some non-dividend payers, and some dividend cutters, all in the same basket (index).
But as the chart below shows, it is not just the negative YOY income of the last 12 months that is problematic; it is the clear trendline down in dividend growth well before COVID (basically, since the post-crisis immediate recovery).
 *Strategas Research, Daily Macro Brief, July 20, 2021
Wait, it’s worse
Now, you may know something that the chart doesn’t show, which makes this decline in dividend growth even more striking – this was taking place in a period where profits themselves were growing handsomely, year, over year, over year. So why would profits be growing at an escalating percentage, but dividend payouts be growing at a reduced percentage? Shouldn’t they be growing in tandem with one another, at least, and ideally with dividend growth even outpacing profit growth due to scale (the more profits, the less needed for M&A and debt and reserves, so the more percentage of the profits that can be returned to shareholders)? The only reason for this mathematically – profits growing at an escalating percentage while dividends grow at a declining percentage – is that more of the profits being earned across the S&P 500 are not being paid out to shareholders. OR, a growing percentage being returned to shareholders through buybacks even as valuations and stock prices are escalating year over year.
Bottom line – this points to a misallocation of capital in corporate America – not at each and every company, but broadly across an index of 500 of them. Ill-advised M&A and poorly-timed buybacks are just two of the negative things that can happen when a company does not prioritize monetizing shareholders.
How to buck this trend?
Achieving a growing income level in the equity markets cannot sustainably happen without intentionality. And even intentionally pursuing it will not suffice without needed due diligence, research, and execution. The whole point of indexing is to lay due diligence, research, and execution by the wayside. In “rising tides lift all boats” bull markets, it is hard to argue with the results of doing such. But for dividend growth, it simply is not an option.
Two different scales to weigh things
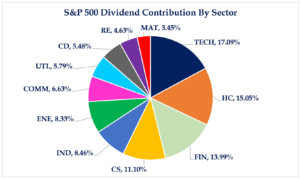
A very compelling explanation for why market indices have become such poor dividend payers and dividend growers is their very construction. Being weighted to their market capitalization has resulted in huge disconnections between the percentage of a given sector in an index and the percentage of the dividend income from a given sector.
Consider this: Energy makes up only 2.3% of the S&P 500, but it makes up 8.33% of all dividends paid.
Technology, on the other hand, is 28% of the S&P 500, but only 17% of the dividends paid.
You can look below and see that the dividend sectors make up a higher percentage of the dividends the index pays but are lower weighted in the index. For some, this may be a problem (I am one of those). For others, it may seem inconsequential. But my point is that there is one way to truly address it to benefit the dividend growth investor: Actively address it and manage it.
*Strategas Research, Daily Macro Brief, July 20, 2021
Speaking of Energy
Oil prices were at $35 or so just nine months ago. They hit $79 earlier this month and have settled around $71/72 as of press time.
So a higher oil price may seem like a perfectly bullish rationale for the energy sector. But something else, more reliable and consistent, has also taken place that is a much bigger reason for energy sector bullishness:
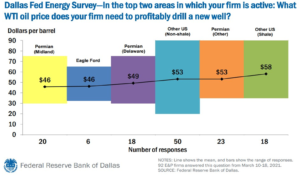
A substantial drop in breakeven prices.
The U.S. shale industry can now make money between $46 and $53 oil, with those Permian and Eagle Ford gifts that keep on giving being on the lower end of that. This means that a drop from $70 to $60 no longer jeopardizes profitability, and in fact, may enhance it because the reduced margin becomes more likely to be made up by increased volume (more demand).
Basic mathematics in thinking about Energy
You pretty much have no chance of beating the S&P when energy is doing poorly if you have a meaningful weighting to energy. Energy is, after all, about 3% of the S&P 500, whereas it was about 15% of the S&P just 12 years ago. Inversely, it’s highly likely to beat the S&P 500 if Energy is doing quite well when one has a meaningful weighting there. Such is the mathematical reality of how sector weightings go in a market-cap weighted index like the S&P (you will recall there was a point last year when two companies in the S&P – just two individual names – accounted for more of the index than four entire sectors put together).
Bottoms up
From my vantage point, the issue must be on individual names within the sector. The dispersion of results across the whole index is too large to take a generic top-down view. The distinctions in earnings growth, free cash flow generation, leverage, return on equity, return on invested capital, liquidity, and other such metrics is so significant that a bottom-up quality-driven approach really ought to be the differentiator in how one gets energy exposure.
I am told I have to talk about it
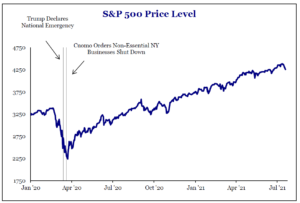
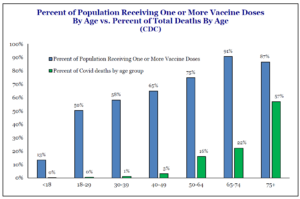
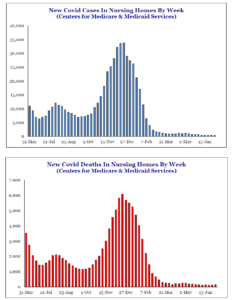
It’s no secret that I am beyond tired of talking about COVID and do not believe there is a real market story in COVID to talk about. When the genie got out of the bottle a year or so ago, though, that the public focus (at least in the media) went to CASES instead of the matters of severity (i.e., hospitalizations and mortalities), it really became inevitable that this would stay in dialogue far longer than it probably should. Now, the market hasn’t fallen for it (one could say the market has been immune from this coverage or thinking), as a plain view of things makes clear.
*Strategas Research, Policy Outlook, July 20, 2021, p. 4
But with CASES (no matter how little the severity or how mild/asymptomatic the cases may be) dominating metrics, reporting, and so forth, it should have been clear even pre-vaccine that even post-vaccine, there was still an angle for a story.
The market’s unwavering dismissal of the way COVID has been covered by far too many can be best understood by this chart here.
*Strategas Research, Policy Outlook, July 16, 2021, p. 4
Or perhaps these two:
*Strategas Research, Policy Outlook, July 16, 2021, p. 5
From the bottom of my heart, I wish that the national conversation and media coverage would fully align with the market reality, which continues to understand the health reality better than so many others seem to. But I have surrendered myself to two realities, one of which I regret but cannot control, and the other one brings me great joy.
(1) The chatter about variants, case infections, and other numerical talking points that do not equal a substantive story in real impact will continue because there are so many who have an inventive for such to continue. But nevertheless …
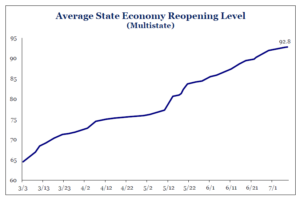
(2) Chatter can’t put this genie back in the bottle. The people wanted their lives back, and here we are.
*Strategas Research, Policy Outlook, July 16, 2021, p. 5
I may be personally exhausted of all this COVID discussion, but it isn’t for me to say as far as others who really want to keep discussing without end. But in terms of what my job is – the actual market and economic impact where we are now in a society largely insulated from further severity, hospital resource depletion, or a wave of fatalities – there is little else for me to say. Which ironically, makes me have to say a lot about how little there is to say.
A cryptic comment
In the last few months, I think a compelling event has been the price action in crypto-currencies like bitcoin, but not merely because of the huge drop. The up and down movements are noteworthy in the highly volatile and speculative “asset,” but that is not why I am bringing it up here. I believe that it would be almost impossible to imagine a better backdrop for crypto bulls than the last few months. A huge argument for the digital play has been erratic or excessive government behavior. Both fiscal and monetary policy have been record-breaking aggressive the last few months – record deficits, record levels of accumulated debt, record Fed balance sheet, record government spending – yet bitcoin retraced 55%. Another huge argument for the digital play has been the need to hedge inflation risk. I am quite sure that the word “inflation” has been uttered more in the last three months than in any three-year period put together for the last forty years. It is the number one news story morning, day, and night – in financial media, political media, and social media. And in the course of this record-breaking inflation dialogue, fear, and price level action, bitcoin has retraced 55%.
I offer no comment on what bitcoin will do next or why. How could I? Speculative plays can only generate speculative commentary, something we don’t traffic in much. But what I can say is that in the course of a pretty big opportunity to compete with an inflation narrative, bitcoin didn’t do (in this moment) what its biggest supporters have stated.
Chart of the Week
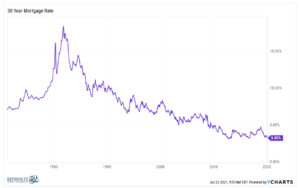
This week’s chart is meant to be a never-old update of the long-term story in Housing, and that is a 40-year decline in the cost of borrowing to buy a home.
Quote of the Week
“Moral courage is the most valuable and usually the most absent characteristic in men.”
~ George S. Patton Jr.
* * *
I enjoyed covering a few different topics today, and I hope one or more of them (heck, how about all of them?) struck a chord with you. Now go start your weekend, and reach out with any questions or comments. And tell a friend about the Dividend Cafe!
With regards,
David L. Bahnsen
Chief Investment Officer, Managing Partner
The Bahnsen Group
www.thebahnsengroup.com
This week’s Dividend Cafe features research from S&P, Baird, Barclays, Goldman Sachs, and the IRN research platform of FactSet


