Dear Valued Clients and Friends,
The first thing I want to do today is provide a link to the Dividend Cafe from LAST YEAR (this very week), one of the most trafficked Dividend Cafes in history. The reason for the re-post, here and now, is that many are celebrating graduations this week (high school or college – it doesn’t really matter), and I wrote this Dividend Cafe a year ago for graduates. The link is here if you want to share this with others or re-visit it yourself. I hope it has some value for someone you know.
Now, as for this week’s actual Dividend Cafe, you are in for a treat. From market valuations (and the half-full glass that goes with the half-empty one) to a bunch of “stuff” about Nvidia to quite a bit about China to sector allocation to the biggest risk in the market, it is a full Dividend Cafe this week. Let’s jump in…
|
Subscribe on |
Not equally expensive
There has been much discussion about the S&P 500’s current P/E ratio of 25x trailing earnings and 21-22x forward earnings. Well, when I say “there has been a lot of talk,” I also mean “I have been doing a lot of talk.” And for good reason.
But a very, very important point needs to be made … the MEDIAN P/E for the S&P is 18x forward earnings (not cheap, but nowhere near the same level of excess of the actual S&P multiple). The FIVE largest stocks in the S&P 500 are currently a stunning (and, I will add, unsustainable) 28% of the index (1% of the companies are 28% of the market cap). Their forward P/E ratio is 31.4x … So, if 28% of the index is trading at 31.4x, and the median of the whole index is 18x, there is a significant valuation differential between much of the index and the top-heavy components. When you buy the S&P 500, you are NOT buying the MEDIAN P/E ratio – you are buying a cap-weighted index that has a cap-weighted P/E. And that is 21x forward earnings. But what all these data points tell us is that the distribution of valuation excess is highly skewed to the top, and there is value under the hood to be found.
Some of that value pays nice dividends and increases them each year.
The Nvidia Factor
It is getting to the point of disingenuity in even talking about the “top five,” let alone the “Mag 7” or the “top 10,” etc. Literally 33% of the return of the market this year – 4% of the 12% – has come from JUST this one name. There may be some who believe that will never reverse, and no point is coming where the large impact of one gargantuan company works in reverse. I would like to do business transactions with such people. But my point is not to make a prediction about one company, let alone do the fool’s errand of attaching it to a timeline. I bring this up because of the impact on the entire index.
As an aside, the top three companies (out of 500) are now 20% of the index. In the ancient history of 2017 (seven years ago), they were 8%.
With a h/t to Larry McDonald, Nvidia was 0.35% of the S&P 500 in 2019 and became over 2% of the index in 2021. It is 6.5% of the index now. One company, 6.5% of the S&P 500. And that company is currently 89% above its own 200-day moving average. In the entire history of Apple, it has spent exactly 24 hours, being just 64% above its own 200-day moving average, and never more than that. Nvidia is 89% above its own 200-day moving average. Microsoft, once in the 1990s, got to be 54% above its own 200-day moving average. But 89%? It’s simply unfathomable. To go up ONE PERCENT from here, the equity has to increase by $30 billion. Let me re-phrase this – if the equity were to go up by the amount of the entire value of ALL of 7-11 (the entire chain of conveneince stores), Nvidia would be up ONE PERCENT. If that example doesn’t do it for you, replace 7 11 with DuPont, Delta Air Lines, Consolidated Edison, or Hartford. You get the idea.
Now, my example above is just for the stock to move ONE PERCENT (did I mention that yet?). But the current total value is greater than all of Amazon, Wal-Mart, and Netflix put together. And it is greater than all of Google, Disney, and Home Depot put together. You get the idea (h/t Michael Batnick).
The top five companies in the S&P 500 were 14% and 18% of the market for basically twenty years (2000-2019). They are over 27% now.
I don’t want to overwhelm you with data points and comparisons. But I did.
The China Model
It is way, way too early to assert that China will not turn to aggressive monetary policy as they deal with their current economic challenges. It is not too early to say, though, that they certainly have not done so yet. It also is true that if it were Japan or the United States, they would have by now. Despite my general feeling that China would emulate the fiscal side of Japanification and would not necessarily emulate the monetary side, I recognize that it is way too early to take a victory lap (plus, in my business, one never, ever takes a victory lap, having learned the hard way as a much younger man that a victory lap was not really celebrating something you got right but rather hastening the next thing you would get wrong). Chinafication is still on the table, and what it does with monetary policy will be a big part of the ultimate outcome.
That all said, if – a big if – China does, indeed, avoid aggressive use of monetary policy, bond-buying, artificially low rates, and huge PBOC interventions to work their way through all of this, I have to think it would be a huge rebuttal to the developed countries (including our own) that have granted deity-like status to their central bank and the use of monetary policy to work through cyclical economic challenges. Maintaining confidence in one’s currency, bond market, and, most importantly, an interest rate that is a reliable, not distorted, price signal may end up proving to be a better catalyst for economic recovery than intervention.
And the irony of that message coming from a Communist country to a free one would be, well, sad.
Anti-fragile by any other name?
One thing I hear nothing about, ever, from anyone other than my brilliant friend, Louie Gave, of Gavekal Research … Chinese stocks have been taken to the woodshed the last couple of years. Valuations are presently at 12-13x earnings, about HALF of the U.S. market valuation, and in many cases, with higher growth rates. At one point, their stock market was down -65% from its peak, and it still remains down -50% from its 2021 highs. AND YET, with Chinese property values getting crushed (down -20 to 40% in most cities), this stock market carnage, and a total dust-up in their corporate bond market, whose sovereign debt (bond market) has performed best on the planet? Well, China has had a 30% better return over the last five years than the U.S. and a stunning 50% better return than Germany! Their currency held in there extremely well, and while the renminbi is currently down to the U.S. dollar in the last two years a bit, it is basically still where it was in 2019 (five years ago), despite all of these dust-ups in their economy and financial markets.
I am not a China bull. I do not trust the CCP. I could write four Dividend Cafe editions in a row, making the case for what China has done wrong and how their internal Marxian framework will not allow them to fix it. And yet, as evidenced by one of the greatest scoreboards ever concocted, the bond market (and its supplemental piece, the currency), one has to conclude that their policy framework on the monetary side has been significantly more prudent than many developed nations. And I say that to the shame of those countries who should have known better.
A humility lesson
For those who recall the Iran-Israel events of April 13 and all the fears that it was about to escalate into a significant geopolitical and market event, a few things to note (h/t Rene Aninao, Corbu):
- The dollar is UP against emerging market currencies since then
- The Nasdaq is higher
- The VIX is lower
- Oil prices are lower
I’d love to see the bingo cards that had that on April 14.
Steady Eddy
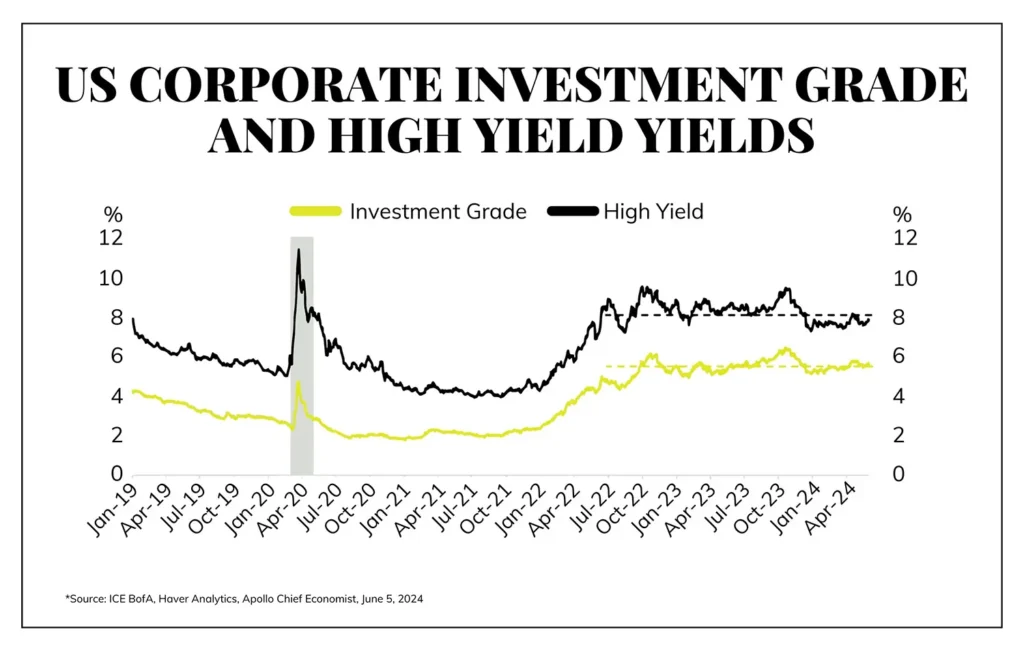
Two years ago, it cost about 8% to borrow in the high-yield bond market. One year later, it cost about the same 8%. Fast forward to today, and it costs about, well, 8%
Investment grade bonds were sitting at about 5% two years ago and had settled to 5.5% one year ago. Fast-forward to today, and accessing the bond market costs the same 5.5%.
Underlying bond yields have moved up and down in the Treasury market, but spreads have moved with them to basically leave corporate bond borrowing costs very consistent for two years and counting. There have been a few moves above and below these 8% (high yield) and 5.5% (investment grade) levels, but really the consistency in what has been a volatile stock and bond market is surprising.

Yield Growth
Only three sectors in the market have a higher dividend yield today than they did pre-COVID – that is Real Estate, Utilities, and Consumer Staples. The other sector, most often lumped in with the “defensive sectors,” is health care, which is basically flat. The reason is essentially two-fold: First, these sectors have not seen the same robust price movement as technology, but even good dividend sectors like energy and financials have seen (our two biggest weightings). However, the internal dividend growth of Consumer Staples, Health Care, Utilities, and Real Estate has also superseded all other S&P sectors. Dividend growth in Technology and Consumer Discretionary has been virtually non-existent (see what I did there). A couple of different market factors are being captured here.
Sector allocation
I constantly hear that the Dow is an inferior index to the S&P 500 because the Dow doesn’t reflect the reality of modern times the way the tech-heavy S&P was. And this sounds like a pretty cool thing to say because any time someone says something that sounds new, modern, and “techy,” there is a good chance they are cool. But I am not cool (I can prove it), I have never felt the need to sound edgy or contemporary (and by the way, what cool kids would ever say “edgy” – let alone “contemporary”), and I don’t think market indices need to reflect what is “cool” or what takes up most media chatter time. I think that a market index has one of two ways of being an appropriate reflection in its weighting of what it is going for – either by weighting according to corporate profits generated (since markets are essentially discounted earnings streams) or else by their contribution to the economy itself. The argument for the former is that it reflects what markets are supposed to reflect, and the argument for the latter is that it creates a market reflection of the real life we all live throughout economic life. My own opinion is that either is fine, and I see an index that reflects profit distribution or economic output distribution as a good thing. But here’s the thing – Technology is 30% of the index, 20% of its profits, and 10% of GDP. The weightings in the S&P (done per market cap) simply do not achieve either profit composition or economic composition.
Now, the Dow doesn’t do it perfectly either, but it is a lot closer (especially on the economic front). The irony is that its “price-weighted” mechanism of how companies are weighed in the index is absurd, yet it has ended up providing a much better reflection of the real U.S. economy for a hundred years than anything else out there. It’s a great example of something we say “works in practice, but not in theory.”
Biggest risk of the second half of the year in the market
My two cents …
- I don’t think it is a person you can’t stand getting elected President (there is a 100% chance that someone 50% of the country can’t stand is going to be elected President).
- I don’t think it is an unexpected Fed rate hike.
- I don’t think it is an escalation in the Middle East.
- And I don’t think it is a bank failure or a traumatic event in commercial real estate.
- I believe it is disappointing corporate spending on technology. I am not predicting this. I am merely saying I believe it is the biggest risk in the second half of the year.
- Now, I am predicting it eventually. I do think of it as inevitable. But no, I am not arrogant enough to attach a timeline to this. But you will know it when it happens (see the second section above).
The Trifecta
The dollar was modestly down in May (not a lot) as markets were up. Oil was down in May (not a lot) as markets were up. Bond yields were down in May (not a lot) as markets were up. Interestingly, oil came down a lot more this first week of June, as did bond yields.
This can change at certain levels of magnitude, but directionally I believe there continues to be no greater correlation to how risk assets (i.e. the stock market) are doing than (a) bond yields, (b) the dollar, and (c) oil.
GDP and me
It does appear a reasonable claim that GDP growth is no longer accelerating as it was in the second half of 2023, even though the fears of contraction we faced in 2022, and the first half of 2023 appear to be long forgotten (I know, there is always someone out there who has predicted twenty of the last two recessions). But what would “slower growth” mean for stocks? Some say it fits the “goldilocks” narrative, whereby it helps the market as slower growth cools inflation and allows the Fed to tighten. Even with slower growth, the economy hums along well, providing a perfect middle ground for the market. And maybe that plays out. But a few things need to be noted:
- Slower growth, even if still positive, that leads to a contraction of corporate technology spending is NOT going to be well-received by the market
- The cyclicals that have done well need growth to exceed expectations, no matter how low those expectations are. Disappointing growth cannot be good for cyclicals.
- And ultimately, all bets are off in thinking about this (or anything adjacent to it) when the starting P/E of the market is north of 20. The analysis and comparison to historical dynamics in a 16-18x are very different than in a 21-25x environment.
I wouldn’t recommend trying to predict what the economy is going to do in the next 3-6 months, let alone the market. But I would recommend leaning into quality. Slower growth = value’s time in the sun. And for our purposes, “value” means dividend growth.
Few strategies ever concocted require less time trying to predict the weather.
Chart of the Week
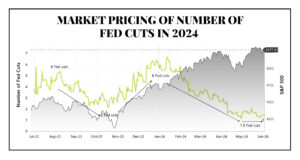
The GRAY below is the S&P 500. The GREEN is the number of rate cuts priced in the fed funds futures market. Notice how the market dropped a year ago when expectations for six cuts came down to two, and notice how the market rallied when expectations re-priced to six cuts again coming into 2024. But then notice the divergence this year – expectations again moved from six cuts to now “1.5” (high odds of one cut and medium odds of a second cut), and yet as those expectations moved lower, the market has gone higher.

Quote of the Week
“It is impossible for anyone to begin to learn that which he thinks he already knows.”
~ Epictetus
* * *
We were thrilled to announce our new Florida office this week and will be even more thrilled when it opens next month. Between the recent large expansion of our Newport Beach office, the pending move to our new (much larger) New York City office, and then the opening of this office in W. Palm Beach, Florida, let’s just say our design team has their hands full [time].
Have a wonderful weekend, reach out with any questions, and never forget what eventually happens to those who believe in an easy buck. It simply never fails. And avoiding that mentality is the end to which we work.
With regards,
David L. Bahnsen
Chief Investment Officer, Managing Partner
The Bahnsen Group
thebahnsengroup.com
This week’s Dividend Cafe features research from S&P, Baird, Barclays, Goldman Sachs, and the IRN research platform of FactSet


