Dear Valued Clients and Friends,
2022 is just two weeks underway, other people are joining me in no longer saying Happy New Year, the NFL playoffs are finally starting (a week later than ever before), and the college football champion has been declared. Coming into the new year was the time to forecast what we expected for the year – but now, we are actually in it.
And speaking of those forecasts, I will keep the white paper in front of you here. But I think we are due for a little update on a few big macro issues, so update you we will. From the glorious spot of the 2022 TBG offsite where our entire team has spent the last day and a half meticulously working on improving our business (in some really significant ways, I will add), today’s Dividend Cafe covers a lot of bases.
I have written ad nauseum about the fact that much of what we discuss when we discuss macroeconomic outlook is really about the state of debt in our economy. Much of what we think and ponder about the Fed comes down to debt considerations. There is much to evaluate on the periphery, but debt levels sit at the middle of a lot of these peripheral concerns, and I will tell you that I am seeing more and more people make truly faulty assumptions that I believe are headed to a bad place.
This is a topic that will illuminate and inform your understanding of many things, and the only place I know to do it is in the Dividend Cafe.
Shoot straight – how is the economy?
One of the more interesting tension points right now is those who would suggest that the economy is vulnerable because the fiscal “stimulus” of the last two years (i.e. various COVID spending bills) largely runs off this year versus those who suggest that the economy is set to benefit from hugely reduced deficits because of that. I find myself disagreeing with both camps but for two different reasons – one on ideology, and one on the facts.
I do not believe the economy is vulnerable with the excess spending of 2020 and 2021 reduced because I do not believe that spending was economically productive to begin with (and my comments apply to the spending packages of both administrations, so this is hardly a partisan commentary). Some was certainly understandable in light of the pandemic, and much of it (especially in 2020) was highly advisable in light of the policy response to the pandemic.
Necessary. Emergency. Understandable. All potential words we can apply. But “productive” is a different story – it is used in the Keynesian worldview to suggest that it was adding to the economy more than the natural course of human action would have. And the removal of “unnatural” spending is not contractionary. What spending is needed in times of emergencies (health care supplies, PPP for small businesses, vaccine distribution) is an entirely legitimate subject of debate, but no, I do not buy into the concern that when the government is not enacting the largest transfer payments in history we are reversing stimulus. Those endeavors – again, whether one believes a particular expenditure to be legitimate or not – are at best case “emergency” measures, and economically are nothing more than a diversion of capital allocation that would otherwise take place – distortive, sub-optimal, and outside best and most productive use.
But what about the idea that it is a good thing to see this deficit spending come down? Isn’t that something a fiscal hawk should be excited about? After all, these fiscal expenditures as a percentage of GDP are coming way down …
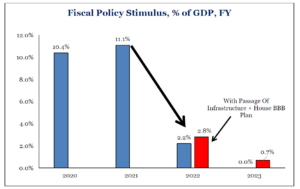
*Strategas Research, Policy Outlook, Jan. 11, 2022, p. 2
The other thing I would mention is that the level of global debt trading at a negative yield has dropped substantially – down to $10 trillion from a high of over $18 trillion. Why do I throw this in the mix of potentially good things? Because every dollar of debt trading at a negative yield is a distorted dollar, reflecting irrationality, fear, and substitute financial objectives from those that are productive and healthy.
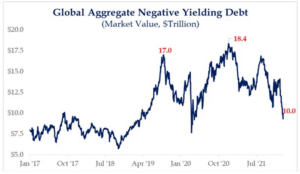
*Strategas Research, Daily Macro Brief, Jan. 14, 2022
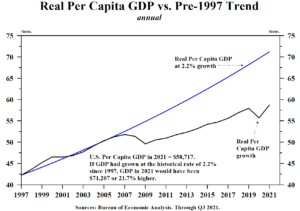
But alas, I would hold off on uncorking those champagne bottles. The issue that must be understood in terms of economic growth is the amount of GDP consumed by accumulated debt – for that is the number that represents the drain on future growth. I am all for them decreasing the rate at which they add to the national credit card, but no one is arguing that this is the rate of trajectory at how much public debt as a percentage of the economy has grown
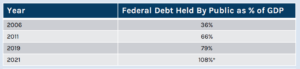
*Hedgeye, Sept. 2021
What does the 108% seem low compared to other numbers you have heard about government debt as a percentage of GDP post-COVID? Because I am being nice. 108% of GDP is the debt the government owes others, whereas there is large inter-governmental debt (like, you know, what they owe to their social security trust fund) that also has to be paid. So the total number is 154% of GDP in real life, a massive increase from pre-COVID levels.
In fact, the total debt levels as a percentage of GDP and by category of debt are fascinating across geographies. These realities speak to the concerns I have about total debt levels when it comes to future economic productivity.

But you said not all debt was created equal?
That’s right, I did. And it is entirely correct. The productivity I would expect about certain private-sector debt is much higher than what I would expect out of government debt (profit motive, rational actors, capital allocation, etc.). But “being levered” makes it very hard to “re-lever” even for a private sector actor. In other words, there is a diminishing return on the debt in the private sector once it reaches a certain level – there are less projects, less endeavors, less uses for the money – and more importantly, there are less qualified borrowers to put the money to work when they are already at peak levels of borrowing.
All things being equal, I would expect greater contribution from the debt of the private sector than that of the government, of course. But this is the heart of the trap in which we find ourselves – productivity of government debt has collapsed, and availability of good borrowers and projects in the private sector has declined.
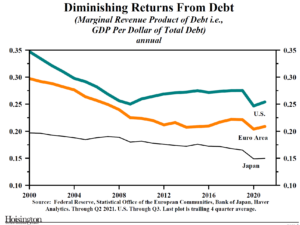
*Hoisington Investment Management, Macro Analysis, Dec. 2021, p. 4
And the consequence to this?
Elevated debt = declining productivity, which = declining economic growth.
I believe there is no greater explanation of economic challenge over the last 15 years, but also social and cultural angst, than what this chart captures:
Stupid simplification (or is it?)
Current debt levels are a separate subject from the fact that extra Keynesian spending is coming down this year, or that the current year deficit spending as a percentage of GDP is going to be lower (a fact that is true, I should add, despite ruling party aspirations, not because of their aspirations).
The sequence of events, economically, in the most simplified way I can say it, is this:
(1) A society lives above its means
(2) That leads to excesses and problems that create economic hardship
(3) To remedy that hardship the government spends money to serve as an offset and create stimulus, and the central bank promotes economic activity with easy monetary policy.
(4) That leads to some periods of feeling good and improved metrics, but that are not sustainable.
(5) Those things in #4 soften, and that intensifies the need for more of #3.
(6) This helps a bit, but then leads to more of #5.
Rinse and repeat.
(7) [YOU ARE HERE] – You find yourself societally with too much debt that means less future growth at a time the people are clamoring for more growth so you make up for what you can’t give them with growth with more fiscal and monetary accommodation which then puts more downward pressure on growth.
Rinse and repeat.
(8) Some of the unintended consequences of the efforts in step #7 have to be undone from time to time. Excesses. Inflation. Distortions. Whatever the case may be. Then in those reversals, there are policy implications, economic implications, and investment implications that have to be addressed.
Where are we now is coming out of #7 and into #8, and I can safely forecast that #9 will look more like a reset of #3. But while we deal with #7 and #8 let’s look to the …
Bottom-line impact to YOU!
(1) Bond yields in a secular and structural sense cannot get to normal levels, because there is too much demand for dollars, too much demand for safety, too much demand for income, and too much global demand for something different than what non-Americans have, leading to significant downward pressure on bond yields. All of those realities put on top of the fundamental slow-growth reality of the overly-indebted modern economy make for a very low ceiling on bond yields. And yet nevertheless, despite not being able to get proper or historical or for many savers, desired, bond yields, we still shall see an increase in bond yields as the adjustment off of zero-bound insanity takes hold.
(2) Oil prices were too low 12-24 months ago as demand collapsed and supply was excessive. The pendulum swing there – demand is sky high and supply is inadequate. This pushes oil prices higher, which also helps push bond yields up a bit (see #1).
(3) Value stocks like #1 and Energy stocks like #2
(4) Housing prices have become too expensive. Low rates have not been useful for greater house affordability because prices have risen more than the impact of the rate decline has helped. So what happens when un-affordability becomes too much to bear? Prices decline, eventually.
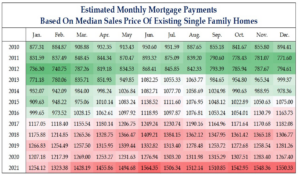
*Strategas Research, Daily Macro Brief, Jan. 14, 2022
So what can change?
Some would say the Fed tapering of QE changes things. They have been a big purchaser of government debt and that is coming to an end in 2-3 months. But note below the long lull between 2015 (end of QE3) and 2020 (start of QE4). The Fed was (a) Not buying government debt, and (b) In 2018 actively reducing their holdings of government debt via roll-off. And what happened to bond yields in that period? The 10-year was 2.5% when QE3 ended and four years later to the day with nothing but bond inactivity or actual bond reduction in between, it was, well, 2.5%.
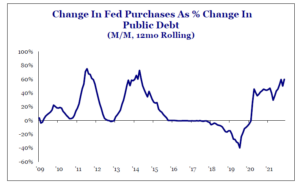
*Strategas Research, 2021 Chartbook, Jan. 3, 2022, p. 38
I do not believe QE (or the lack thereof) will prove to be the dominant factor in equity considerations or bond yield considerations going forward.
In conclusion
The dominant issue in the economy in any time frame above ten minutes is the overall level of debt and its impact on growth. Bond yields, gold prices, Fed action, Fed reaction, and so much more all play in.
But investors trying to trade their portfolio around short-term “periphery” (the noise involved in phase #8 above) will miss the forest for the trees. The major issues of global excess debt are not going away – even as the ups and downs of policy actions and reactions play out.
And through it all, I can’t imagine a better solution than quality focus in one’s portfolio, with strong appreciation for cash return to us. We’re going to want it.
Chart of the Week
Is it too early to talk 2023? Yes, it is. And do I generally hate these historical correlations? Of course. But this just is what it is.
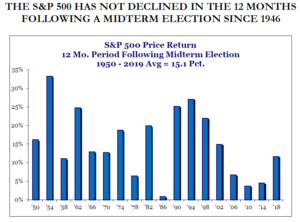
*Strategas Research, 2021 Chartbook, Jan. 3, 2022, p. 58
Quote of the Week
“People can foresee the future only when it coincides with their own wishes.”
~ George Orwell
* * *
We’re going to devote next week’s Dividend Cafe to the topic of the red-hot energy sector. It is likely that Energy investors have been very happy with returns for the last 14+ months, but what do the next 14+ months hold? And what is in store for the world of energy for the next 14 years? I don’t think all I want to say here can or should be covered in the readers’ digest pages of DC Today, so next week’s Dividend Cafe will bring you the deep dive the subject warrants.
In the meantime, Go Cowboys, enjoy your long weekend, and I will see you next week from the freezing streets of Manhattan vs. the 70-degree beaches I am staring at now. This is the life I chose.
With regards,
David L. Bahnsen
Chief Investment Officer, Managing Partner
The Bahnsen Group
www.thebahnsengroup.com
This week’s Dividend Cafe features research from S&P, Baird, Barclays, Goldman Sachs, and the IRN research platform of FactSet