Dear Valued Clients and Friends,
Markets followed up their monstrous week by dropping a bit to start this week, then rallying back to even mid-week, to sit somewhere between flat on the week and down ~100 points or so as I prepare to go to press.
The Nasdaq, though, didn’t fare so well on the week, dropping -600 points (-4%) as of press time and warranting a distinction in this week’s Dividend Cafe on how one may want to think about their assets in the Fed regime ahead.
This one week aside, and the never-ending obsession with the Federal Reserve well-baked into our societal financial fabric, there is a lot to say about a changing of the guard at the Fed, and this week’s Dividend Cafe is devoted to just that. Some things are, no doubt, changing, but other things, as you will soon see, are not changing at all. Understanding all this may be the best Christmas gift I can offer you this glorious holiday season.
Slide down the chimney into this week’s Dividend Cafe …
Fed redux
So the market rallied upon the Fed repeating what was well-declared ahead of Wednesday’s meeting – that the Fed is set to stop buying new bonds with fake money by March or April and that they will get off the zero-bound with interest rates in 2022. Why did the market go higher? Because the market knew all of that and then detected a few other things, I will unpack in a bit.
A Little Perspective
If the Fed does hike rates three times per year for the next two years, we would be at a 1.5% fed funds rate – in 2024! That is lower than the Fed Funds rate was in 2018 and 2019, and it would essentially mean a NEGATIVE real yield if one assumes 2-3% inflation.
Seeing is believing
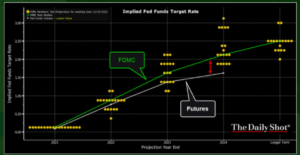
One of the points I have tried to make over and over again is that the market does not respond to what the Fed says or what the Fed forecasts, but rather what the market believes the Fed will do, and of course, what the Fed ultimately does. Here you see in the green line what the Federal Open Market Committee has said about their thoughts on the fed funds rate in the years to come, and in the white line, you see what the Fed funds futures market is pricing. And it is a massive reason for market disconnect from Fed language – they don’t believe it! That disconnect has been almost a constant since the Great Financial Crisis.

*Bloomberg, Dec. 17, 2021
Now, what would happen if the Fed Funds Futures market was just flat-out wrong – if the Fed shocked the market by hiking interest rates when no such thing had been priced in? Well, it’s almost hard to say what would happen since the last time it happened, I was 20 years old, and Orange County went bankrupt over it. The Fed has not truly surprised markets (to the upside with rates) since 1994, and it hasn’t really done a shocking rate cut since 1998 (the 2001 and 2020 cuts were not pre-priced in, but neither was 9/11 or COVID).
So I will stipulate that markets would recoil at a shocking and unexpected rate hike that futures markets had not priced in. But I will also stipulate that the reason fed funds futures rates now permanently live below FOMC dot plots (their own further-out predictions of where rates are going) is because time and time again, the Fed has earned this delta in expectation.
2016’s lack of rate movement (election year) all year long as the dot plot called for four hikes.
Changing the unemployment rate target lower and lower and lower post-GFC to avoid increasing rates.
Adding a 2% inflation target to avoid increasing rates.
Making the 2% a multi-year “average” to avoid increasing rates.
And so forth and so on. Market shocks are not a part of Fed policy, whereas guidance now is – sometimes comically so (I mean heaven help us if we thought this tapering stuff at the last two meetings was a surprise after SIX MONTHS of telling us what they were going to say to us when they tell us what they are about to say to us).
Fed funds futures provide an imperfect indicator of where rates will be in the future, but a better indicator than the FOMC’s own indications.
Enough About Rates
The issue before markets, not now, but in years ahead, is the Fed’s balance sheet. I do not mean “tapering” – the levels of QE we have seen for some time have been irrelevant and tapering that QE down is a no-brainer. But before I go on to explain what I mean by the “issue before” us, I should also explain what I mean by “markets” – because I really am not talking about the stock market. I am talking about the credit markets. And yes, the stock market surely receives an impact from what happens in the credit market. Still, it is the credit market itself that I believe spooked the Fed out of quantitative tightening in late 2018 and will be the credit markets again that call the shots in the years ahead. Why?
Because the Fed made it so.
Monetary tools
The very simple fact is that the very same logic calling for the Fed to quit adding to their balance sheet with more bond purchases (quantitative easing) also implies the need to reduce the same balance sheet. If adding to this balance sheet is excessive and unhelpful, so is maintaining a $9 trillion balance sheet. What should the “ideal state” balance sheet for the Fed be in a post-COVID normalized world?
My friend, Rene Aninao of Corbu, does a simple back of a napkin that seems to me to make a lot of sense:
The pre-pandemic balance sheet of $4 trillion-plus $2 trillion of standing repos equals a $6 trillion balance sheet policy goal, meaning at a current $9 trillion level, they would have $3 trillion to reduce to get to ideal levels (“steady state”).
It is hard to justify raising rates substantially when you still have $3 trillion of excess funds on your balance sheet. A far more impactful tightening of monetary policy can be achieved by reducing those excess reserves than hiking rates and inverting the yield curve. So what will they do?
2018 and 2019
Our 2019 started with a Jerome Powell presser that everything he did and talked about in 2018 was over. No more rate hikes, now rate cuts. No more quantitative tightening, back to offsetting the “roll-off” (i.e., buying more bonds to stay even when other bonds on their balance sheet mature). What preceded this historical monetary capitulation?
Credit markets seized up in late 2018 when the simultaneous policy tools of hiking rates over 100 basis points and quantitative tightening took too much of a toll. The issue I believe the Fed has to wrestle with now is what they can learn from 2018 to basically do different in 2022-2023, yet with the same policy aim in mind.
My best guess? It will mean quantitative tightening but not in concert with rate hikes. Ergo, I see them hiking enough in 2022-2023 to get the fed funds rate off of the zero bound (assume a 1.5% destination by the end of 2023), THEN a pause in rate hikes to focus on balance sheet reduction (but not at the same time as rate hikes).
What comes of this?
If these policy objectives are correct and unmodified, it will surely be more challenging for asset prices in 2022-2024. The most overheated areas would be most impacted. And we shouldn’t fool ourselves into believing that the Fed is the only game in town when it comes to impact on financial markets. My expectations for Fed policy impact on investing can’t be looked at in a box – there must also be allowance for geopolitical realities, fiscal realities, capex cycles, etc. But I believe investors should expect two things in the next 1-3 years as far as it pertains to Fed impact on asset prices:
(1) A general tightening environment that makes “easy money” in risk asset investing far harder to come by and poses a greater risk to more excessively priced assets than we have seen since the financial crisis
(2) Frequent periodic moments of the Fed pumping the brakes on their rhetorical commitment to tightening, finding excuses as needed to let dovishness trump hawkishness as markets gyrate or some news event or another provides cover
Are some prices overheated?
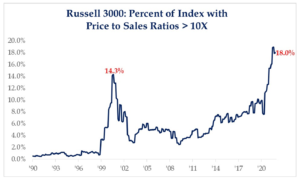
The number of companies trading over 10x their gross revenues is now 28% higher than a pre-dotcom bubble.

*Strategas Research, Daily Macro Brief, Dec. 17, 2021
I am putting this out there anecdotally. There are a million valuation metrics (none of which show things particularly cheap, but some show less gravity in the valuation premium than others). These things are also not good timing vehicles, as history has proven (it is one of the reasons I have been diligently careful not to offer a timeline to some of my commentary on excess valuations in the tech sector). I simply believe that these facts and figures help paint a picture that many investors need, even anecdotally.
What bubble?
My contention has been unrelenting and unambiguous in my conviction around this, that excessively accommodative monetary policy creates a misallocation of resources, not always visible at the time, that results in mal-investment, which must ultimately be purged from the system. This is what we call a boom-bust cycle, and this is what I believe we have been living in for quite some time.
Specific claims about the current shiny object insanity are both non-provable and non-falsifiable and therefore unhelpful … How much of the market multiple is Fed driven (some certainly are, but how much no one can say). What degree of the crypto mania is Fed-driven? How has the Fed pumped up an appetite for risky tech stocks? How much of home price appreciation is low rate-driven vs. low supply driven? Etc. Etc.
I know that the Fed has a role in all of these things, and I also know that I can’t scientifically establish how much of a role in any case.
But here’s the thing about how the Fed sees their role regarding “bubbles”… Alan Greenspan himself explicitly shot down the idea that the Fed could play any role in leaning against bubbles, claiming that:
“Moreover, it was from obvious that bubbles, even if identified early, could be preempted short of the central bank including a substantial contraction in economic activity, the very outcome we would be seeking to avoid.”
His view was that economic expansion “promotes a greater rational willingness to take risks, a pattern very difficult to avert by a modest tightening of monetary policy.”
Valuations that become disconnected from reality DO exist, and the Fed does play SOME role in creating that phenomenon. The inflation of bubbles and bursting of bubbles:
“(a) distorts resource allocation, (b) affects the central bank’s target variables (such as inflation and output), mainly via wealth creation and destruction, and (c) threatens market liquidity and financial stability.”
(h/t to Corbu for turning me on to this paper by Alan Blinder published at the Kansas City Fed in 2005)
But the Fed believes that (a) Once a bubble has formed, there is little they can do that will not make the problem worse, (b) There is a greater risk of wrongly labeling something a label than of not labeling it a bubble, and (c) What they did or didn’t do to allow a mal-investment bubble to take hold is irrelevant in the present tense – they must be focused on the price level and full employment.
Do I think the Fed is currently worried about the price level and a healthy jobs market? I certainly do. They may take action or refuse to take steps that differ from my views, but I am sure that they are far more worried about seeing the CPI number come down than reigning in speculators and day traders.
I do not believe the Fed is unaware of their policies’ impact on asset prices, but I do not think they care. Whether or not they are right – that essentially a mispricing of assets from time to time that has to correct is the price we pay for a system of strong employment and a moderate price level – is not really my point (but yes, if you must know, I do disagree with them). What does matter is not that they are right or wrong, but simply that they believe it.
And once you know that the Fed is (a) Playing a role in fueling asset bubbles, and (b) Not concerned about the fact that they are doing so, you have a significant set of facts in your pocket to digest into your portfolio planning.
CONCLUSION
If rates are going to be modestly rising …
If optics into financial markets are skewed by Fed distortions right now …
If volatility is going to increase around the reality of less Fed coddling …
If quantitative tightening is going to impact credit markets and credit spreads …
If high-valuation assets are vulnerable to an end to the period of rank enabling …
Then I can think of nothing I would rather be invested in than something that:
(a) Grows its income distribution year over year
(b) Is free cash flow driven and therefore less exposed to the opaqueness of modern financial markets in this Fed-distorted world
(c) Enjoys a far lower volatility profile than other risk assets
(d) Is less leveraged and has greater balance sheet stability, therefore, less vulnerability to tighter credit markets
(e) Is not dependent on growing P/E ratios, and in fact, is reasonable valued
So yes, in conclusion, I cannot think of a better solution to our woes than …
Dividend Growth Equities
Chart of the Week
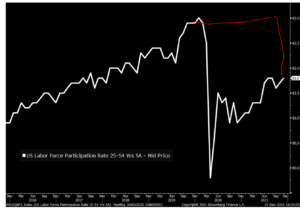
If there were ONE post-COVID economic chart or metric I would restore to pre-COVID levels if I could by the wave of a wand; it would be this one – the Labor Participation Rate:

*Bloomberg, Dec. 16, 2021
Quote of the Week
“Changes in the general level of prices have always excited great interest. Obscure in origin, they exert a profound and far-reaching influence on the whole economic and social life of a country.”
~ Kurt Wicksell
* * *
The final DC Today of 2021 will come on Monday, and from there, it is holidays, kids, church, meals, Christmas in the city, lots of outings and events, family, food, and, yes … My annual white paper. So we all have something to look forward to.
I enjoyed writing this Dividend Cafe, and I look forward to your feedback and questions. And since there will be no Dividend Cafe next week, I will say now from the bottom of my heart – Merry Christmas to you and yours!
With regards,
David L. Bahnsen
Chief Investment Officer, Managing Partner
The Bahnsen Group
www.thebahnsengroup.com
This week’s Dividend Cafe features research from S&P, Baird, Barclays, Goldman Sachs, and the IRN research platform of FactSet


