Today I want to talk about portfolio design. Specifically, I want to start with the basics; the foundational concepts of how one begins to build a portfolio.
But first, let’s talk a little bit about road trips…
Headed North
I grew up in Northern California, Napa to be exact – wine country. When I turned 18, I headed south to Orange County and never looked back.
My family, and a lot of my friends, still reside in Northern California, so I make the trek to visit a few times a year. This is about a 450-mile drive, depending on the route you take. You can take the straight shot via the 5 freeway, or you can take the coast. If you take the 5, it will be much faster, but it isn’t very appealing from a scenic perspective. While the coast will take much longer, you will be dazzled by some of the most beautiful scenery our country has to offer.
A quick side note, I have a fairly decorated passport, and I’d say that Big Sur, California, and the central coast is some of the most beautiful landscape in the world. Where the redwoods meet the beach.
So, what’s the best route when driving to Napa? It depends, what’s your objective – speed or beauty?
Investing and portfolio design isn’t too dissimilar. There isn’t a definitive “best” because it depends, what’s your objective – stability or growth?
Keep It Simple…
As we’ve discussed in the past, every investor wants stability and growth, and they can have one, but not both.
Now, I want to oversimplify portfolio design. Remember, when we oversimplify, we get the benefits of making something understandable/palatable, but also we know that this oversimplification will be incomplete. A great educational foundation but not robust enough for the actual application.
We take this approach (oversimplifying) a lot in financial planning, we often refer to it as “back-of-the-napkin.” These are shortcut financial planning equations and rules of thumb that allow for fluid dialogue, but in the end, we lean on a more thorough, all-encompassing financial plan.
So, in the spirit of keeping things simple, let’s start the portfolio design conversation with just two ingredients – stocks and bonds. Reminder, stocks are equity ownership in publicly traded companies, sometimes referred to as “equities.” Bonds are funds lent to an organization accompanied by an agreed-upon interest rate and payback (maturity) date, sometimes referred to as “fixed income.”
Ingredients & Expectations
Okay, now we have our two ingredients and we are ready to begin cooking/designing. Stocks will be our mechanism for creating growth in a portfolio, and bonds will provide us stability. Again, simple.
Historically stocks have generated, on average, over longer time horizons, high single-digit returns. Bonds, on the other hand, have delivered mid to low single digits returns, on average. For our hypothetical, let’s assume that on a go-forward basis, stocks will return 7%, and bonds will return 3.5%. This differential – between stock returns and bond returns – is what we call an equity risk premium, basically a higher assumed rate of return accompanied by higher assumed price volatility.
When designing a portfolio, two primary factors that are often considered are the expected rate of return and the maximum drawdown. The “maximum drawdown” expresses what a worst-case scenario would look like for this portfolio. This metric is expressed in percentage terms and represents the potential peak-to-trough change in value.
Dialing it In
Next, let’s close our eyes and imagine a large dial that you could spin to the left or spin to the right. This dial is a bit smaller than the size of your hand, so it’s easy to palm/grip and dial left and right. If you spin that dial all the way to the left, as far as it goes, you create a portfolio of 100% stocks. You spin the dial all the way to the right, you create a portfolio of 100% bonds. As you toggle left and right from these extremes, you are adding and subtracting from these portions of stocks and bonds. As you might imagine, as you click that dial to its rotating midpoint, you’d find a portfolio of half stocks and half bonds.
In addition to seeing the proportion of stocks and bonds that are in this portfolio you are creating, you are also seeing two other metrics populating. Our imaginary dial has a digital screen that is providing you with this information. One of those metrics is the expected rate of return of your designed portfolio, and the other is your maximum expected drawdown.
We learn that when we crank that dial to its extreme left, where our portfolio is all stocks, we see an average expected rate of return of 7% and a potential worst-case-scenario drawdown of 50%. Whip that dial right to its other extreme, and our all-bond portfolio populates an expected return of 3.5% and a drawdown of 15%. I should note that we are making a hypothetical here, so these estimates are not predictive but rather just what I would conclude as reasonable assumptions.
Beyond the Metrics
For investors, these two metrics are much more than just numbers, they are tension points that will impact our emotions. As I often say, we are emotional beings, and what may be the optimal portfolio created in the financial laboratory might not always be tolerable based on your own personal temperament. Remember, in personal finance, investor behavior is a big component of success.
That expected return figure is going to have a big impact on your financial plan. Your return will help to determine how much you need to save annually for your child’s college fund, when you can feasibly retire, how much you will potentially bequest to your heirs, and so much more. Obviously, higher rates of return will get you to your destination quicker, much like our drive on the 5 north to Napa.
The potential maximum drawdown that you might experience is going to speak directly to your tolerance. I imagine this being like standing in the middle of a theme park, looking around, and categorizing the rides based on what you will ride and what you absolutely will not. Some of those drops and loopty loops have you opting out immediately; some of the other rides have that right balance of risk and joy that translate to fun for you.
If you take the emotional reactions to these metrics to their extremes, we find an unquenchable lust after a higher rate of return is greed, and a debilitating reaction to drawdowns is an unhealthy fear. It’s often said that those maximum tension points of fear and greed are what turn markets from one direction to another. Sir John Templeton said this much more eloquently when describing those market turning points, “Bull markets are born on pessimism, grown on skepticism, mature on optimism, and die on euphoria.”
Your Design Bias
Okay, back to our portfolio design dial. Now you have an idea of why you might toggle a bit more to the left (stocks) or a bit more to the right (bonds). We are starting to get the idea of how a portfolio is crafted and the tradeoff between returns and drawdowns (risk).
In my experience, most investors tend to be more influenced by fear than greed. They naturally magnetize towards the desire for shallower drawdowns and self-identify as “conservative” or “moderate/conservative.” I think it’s really important to be aware of this leaning when you are going into the portfolio design process.
Let me express this in a slightly different way. One of those back-of-napkin finance calculations is “the rule of 72.” This basically says that if you divide 72 by your expected rate of return number, the output will be how many years it takes to double the value. So, a 7% expected rate of return (72/7) means that your money would double in approximately 10 years. Going back to our stock and bond return assumptions, we had stocks at 7% and bonds at 3.5%. At first glance, those numbers don’t seem or feel extremely different, but when put in terms of “doubling-years,” stocks are poised (based on our hypothetical assumptions) to double in 10 years, while it would take bonds 20 years. Think about your life, how many 20-year periods do you have left? How many 10-year periods do you have left? I hope this descriptor helps us to better digest how different those returns are and the varying impact they would have on your financial plan.
Fear Not
Let’s talk more about this natural affinity towards more conservative allocations – for our visual, this was dialing the portfolio to the right (more bonds). I would argue, as I did, that this is birthed out of fear, a fear of losing what one has worked hard to accumulate. To be clear, we are not talking about coin flip investments – heads you double your money, tails you lose it all – we are talking about volatile investments (e.g. stocks) that can have drawdowns that feel like a loss. These drawdowns do reflect a loss on paper (temporary), but bad investor behavior leads folks to lock in these losses (selling after a drawdown), turning something that was temporary into something that is permanent and financially damaging. So, whether it be the fear of those drawdowns, a fear of how you might behave, or a fear birthed from past experience, we see that fear is often driving the design of one’s portfolio.
More Than Semantics
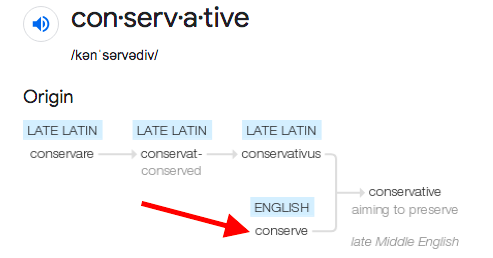
Another common fear for investors is whether they will have “enough,” The fear of outliving one’s nest egg. So, we have a fear of losing what we already have and a fear that we might not have enough. Again, the common reaction is to be “conservative” or what we believe to be conservative. Look at the etymology of the word conservative:

Here’s how the Oxford dictionary defines that root word conserve: “protect from harm or destruction.” In my experience, the two greatest causes of long-term harm and destruction to an investment portfolio are (1) investor behavior and (2) inflation. The true conservative portfolio should conserve, which means it must address both investor behavior and inflation.
We’ve said it before on this blog, the best hedge against inflation is stocks. Therein lies the dichotomy, as stocks are volatile, which can create an environment conducive to bad investor behavior. This is why I often argue that perhaps the greatest contribution of a financial advisor will be to help an investor behave better. At The Bahnsen Group, one attempt at this is to better educate our clients about how markets work and what they should expect. Clarity is key; knowledge is power. The reason I want to challenge you to redefine what conservative means is that I believe an appropriately designed portfolio will be the best solution to the fears you have about running out of resources.
A Visual Aid
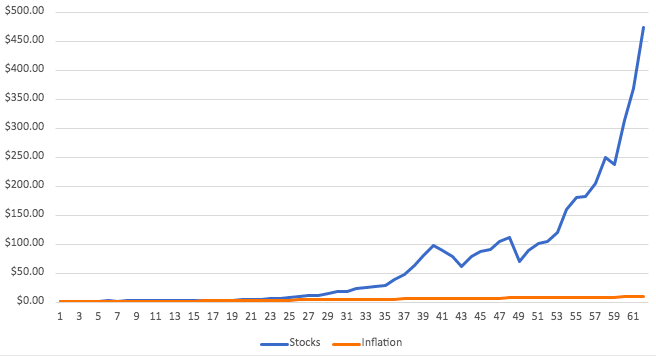
This is (see below) a look at inflation versus the stock market from 1960-2021. This is a time period with above-average inflation, so definitely not a “cherry-picked” sequence. You can translate this as the growth of your portfolio (at least the stock portion) versus the growth of your expenses. Here’s was we see, two lines that are indistinguishable in the short run, yet in the end, the “finish line” gap is as wide as could be. Another translation, if an investor is able to stay the course and behave, they will give themselves the best opportunity to “conserve” their resources.

In Conclusion…
I hope this oversimplification around portfolio design was helpful. For me, imagining that dial and being able to toggle it between those simple options – stocks and bonds – and watching its impact on returns and drawdowns is very helpful. The next stage or step, which we will leave for a future discussion, is how you layer on other allocations (real estate, high-yield debt, etc.) to better meet your expectations around returns and drawdowns.
Ultimately, a portfolio is meant to meet the objectives of a financial plan. This is why there is not a “best” or “better” investment, each investment has features and benefits that are most appropriate for different objectives. Just like our drive north, we have this tradeoff between speed and beauty.
As we discussed, maybe our entire financial culture has mistakenly defined what it actually means to be conservative.
Until next week…


