The end of the year is a season when I conduct a lot of review meetings with clients. Along with discussing holiday plans, sharing updates on our families, and so on, it’s the perfect opportunity to do some year-end tax planning, review how investments have fared over the year, and to catch up on any other planning items we are working on. It’s also a great opportunity to itemize our goals and notate tasks that we’d like to get completed in the coming year.
While these client meetings are never exactly the same, some themes come up time and time again like that of the math behind “total return.” I’ve found myself writing this equation down with a sharpie in numerous client conversations:
 I know, it’s simple. It almost seems silly to mention, but there is so much behind this simple equation that I think it’s worth discussing. I’ll use the example of three areas most people are familiar with as it relates to their assets and the value they derive from each of them – Real Estate, Stocks, and Bonds.
Real Estate
Let’s imagine you purchased a rental property. You saved up some money, scoured through Zillow, and found that perfect investment property. What criteria did you enlist to make your buying decision? Pretty simple, right – you are hoping that you can get a return on your investment. Here are some of the typical steps you took to make this investment: You had stored up some money in your savings account, it was a surplus on your personal balance sheet, and you believe that the returns you can generate from this investment property are more favorable than the expected return on your cash. This is a logical thought process and one that many investors contemplate and execute.
Ok, now you own the property, how do you plan to measure your returns on this investment? If we were going to oversimplify this equation, we’d say that you expect the property to appreciate in value over time and you expect to collect rent (income) on a monthly basis. And this gets us back to our equation:
Total Return = Appreciation + Income
After being a landlord for some time, you’d come to learn that you don’t have a ton of control over the appreciation of the property. Sure, you could fix it up and try to drive up the price-per-square-foot but the comparable sales in the area and the general current of the real estate market would drive a majority of said appreciation.
Again, over time you would learn to tune out this part (appreciation) of the equation and shift your attention to the income (rent) factor. Appreciation is never realized until the property sells, but the income shows up in your bank account each month. A prudent landlord would want to raise rents every few years (within reason), keep a high occupancy rate and do absolutely whatever they could to protect this part of the equation. For a landlord, collecting income in the form of rent is priority number one.
Bonds
Ok, now let’s shift the conversation – same equation, different asset. First, just a quick refresher, bonds are money that an investor lends to a corporation, municipality, or government in exchange for a fixed interest payment.
As an example, if I was to lend the US Government $100,000 for 10-years they’d agree to pay me approximately 1.8%, twice a year I would get a payment for $900 and then at the end of the 10-years the US Government would pay me back my $100,000 I lent them. If I needed my money back sooner, then I would have to find an investor to replace me – I would sell my bond and a new person would take my role as the “lender.”
Based on this description, it is easy to understand the “income” side of the equation, but how in the world would a bond appreciate? Well, this is a conversation I am having a lot in 2019 because most investors have a portfolio of bonds that have a total return that is much greater than the expected income (or yield) of their portfolio.
Let’s discuss how a bond appreciates. We noted that the current “going rate” on a 10-year government bond is approximately 1.8% and if we looked back 1-year we’d find that same type of bond was being issued in December of 2018 with a rate of approximately 2.8%. Interest rates fluctuate daily, so the US Government is constantly adjusting what fixed rate they are willing to pay their lenders. Earlier we also mentioned that a bondholder could sell their bond before the 10-year maturity date. So, if I have a bond that has 9 years left on it and it is paying a rate approximately 1% higher than the new issues of similar bonds how am I compensated for owning this more attractive bond? The bond appreciates in value, the price you could potentially sell it for is more than what you actually lent out. Another investor is willing to pay you a premium because the income produced by your bond is more attractive.
If you review the performance of your bond portfolio for 2019 and you know that the expected income is 3% and that the total return this year is 8%, what can you assume? That 5% came from appreciation because Total Return = Appreciation + Income. This matters because the equation can also be written this way Total Return = Appreciation or Depreciation + Income and from our primer above, as you might assume if interest rates drop then your bond portfolio will appreciate but if interest rates rise then your bond portfolio will depreciate. This is the inverse relationship between interest rates and bond prices. So, the appreciation you are seeing this year unless realized by selling the bonds will eventually deteriorate as you get closer to the maturity date of when you are scheduled to be paid back the fixed amount that you lent out.

SOURCE: Pimco
When it comes to bonds, understanding this equation allows you to set the right expectations around future returns. So much of being a successful investor is about setting the right expectations. This allows us to avoid emotions like disappointment or surprise that typically lead to poor investor behavior.
Stocks
When it comes to stocks, income comes in the form of a dividend payment. Some company’s pay a dividend and others don’t. Our firm, The Bahnsen Group, happens to specifically focus on companies that not only pay a dividend but also have a reputation for growing that dividend on a yearly basis. We are dividend growth investors.
Dividends aren’t sexy though. They don’t capture much media attention. The appreciation side of the equation is the favored child. When the Dow Jones hits a milestone like 25,000 the news will devote a whole day of celebration to it. Yet again, I say, Total Return = Appreciation + Income.
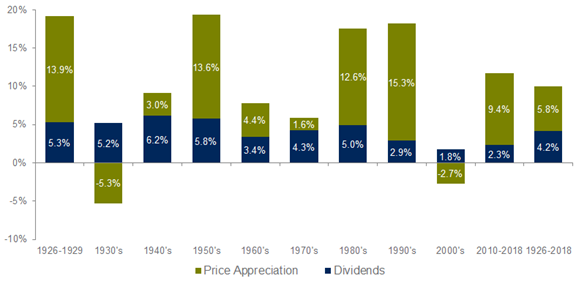
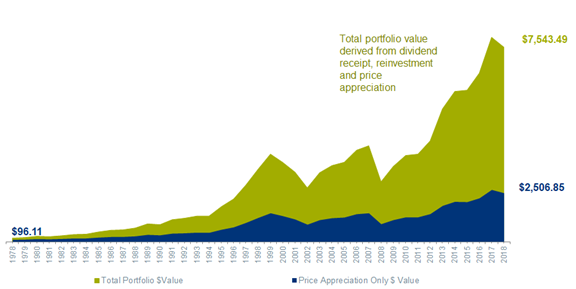
Do these dividends really make a difference though? Yes! As you can see from the charts below, dividends have a BIG impact on driving total return.
CONTRIBUTION OF DIVIDENDS TO THE S&P500® TOTAL RETURN(1926-2018)

GROWTH OF A HYPOTHETICAL INVESTMENT IN THE S&P 500 INDEX
REINVESTING DIVIDENDS (12/31/1978– 12/31/2018)

SOURCE: ThomasParners
We learned from the other assets – real estate and bonds – that appreciation can be unpredictable and sometimes fleeting. A seasoned investor would almost be best to consider appreciation as a bonus, a cherry on top, a pleasant surprise. And just like our exampled landlord, it would be wise to devote much of our attention to the income.
When it comes to investing, drawdowns tend to cause the greatest anguish. A drawdown is a change in value from a top to a bottom. We naturally anchor our focus to the highest historical value and compare that to the current price/value. I like how Cullen Roach describes it, “The stock market is the only market where things go on sale and all the customers run out of the store.” Drawdowns are an emotional trigger, so let’s take a look at the historical drawdowns of price vs. income.

Source: www.awealthofcommonsense.com
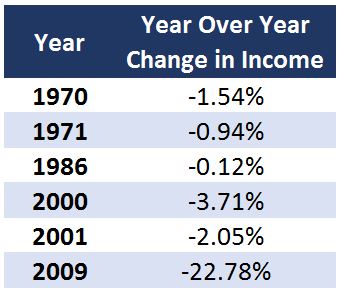
The above chart illustrates that price drawdowns have been drastic and frequent. Now let’s take a look at “income drawdowns.” From 1960 to 2018 the S&P 500 has only had a year-over-year decrease in income (dividends) six times:

Source: The Bahnsen Group
That is a BIG difference in historical drawdowns. A small handful for income, compared to a plethora for price. Not to mention that price declined by +50 multiple times, while the changes in income were much more tolerable and sometimes almost unnoticeable.
Conclusion
As we said from the get-go, the equation is simple Total Return = Appreciation + Income. Yet its simplicity doesn’t diminish its importance. I hope you gathered from today’s conversation that income doesn’t really capture much of our attention yet it can often be the more impactful of the two metrics. Maybe a good question to conclude with is, how much income does your investment portfolio produce?
Until next time…


