Dear Valued Clients and Friends,
We had an interesting week in financial markets … The Fed did exactly what they were expected to by any reasonable person – nothing more, nothing less. They acknowledged the economy is improving, they said they were “talking about talking about” slowing down their quantitative easing. And they indicated two years from now as a time where the fed funds rate may be 50 basis points higher than it is now (may it be so).
And that was it. No actions, policies, or steps. No commitments, promises, or assurances. Just loose language around some policy measures that are (a) Brutally obvious, (b) Not remotely hawkish, and (c) Not nearly enough if the conditions people are saying they are worried about are actually present.
So how did people respond? After three months of people saying “inflation is here” and the “Fed must act” – what happened?
Commodities got hammered, and the yield curve flattened more than it has in ages.
You can’t make this stuff up.
But rather than re-hash what I think the Fed will do, or what they should do, or what is going on in the inflation ad nauseam discussions, I think this week’s Dividend Cafe needs to better unpack what the real, actual, accurate under-current is to all of this.
The interest rate in our society matters, but why? Money supply and inflation is a topic of discussion again, but why? Debates about expected growth impact market valuations but why is expected growth a debate? The Fed’s balance sheet is something barely anyone in America remotely understands yet it has become a frequent point of hand-wringing. Why?
More or less, every single topic being discussed right now has as its true foundation the reality of debt. The accumulation of debt. Concerns about debt. Plans for more debt. Questions about servicing of debt. The promise of debt. The fear of debt. The cost of debt. For a four-letter word where 25% of its letters are actually silent, this is a pretty potent word in 2021 economics.
And it is the subject of this week’s Dividend Cafe. Let’s dive in.
Let’s get the easy part out of the way
I have used about half of this year’s Dividend Cafe bulletins to lay out my thesis that excessive government debt creates a “Japanification” effect. I believe the May 7 Dividend Cafe may have been one of the most useful in summarizing the basic theory of the case; namely, that there is strong historical precedent and strong present reality pointing to a problematic suppression of future growth that comes from government indebtedness.
The government math
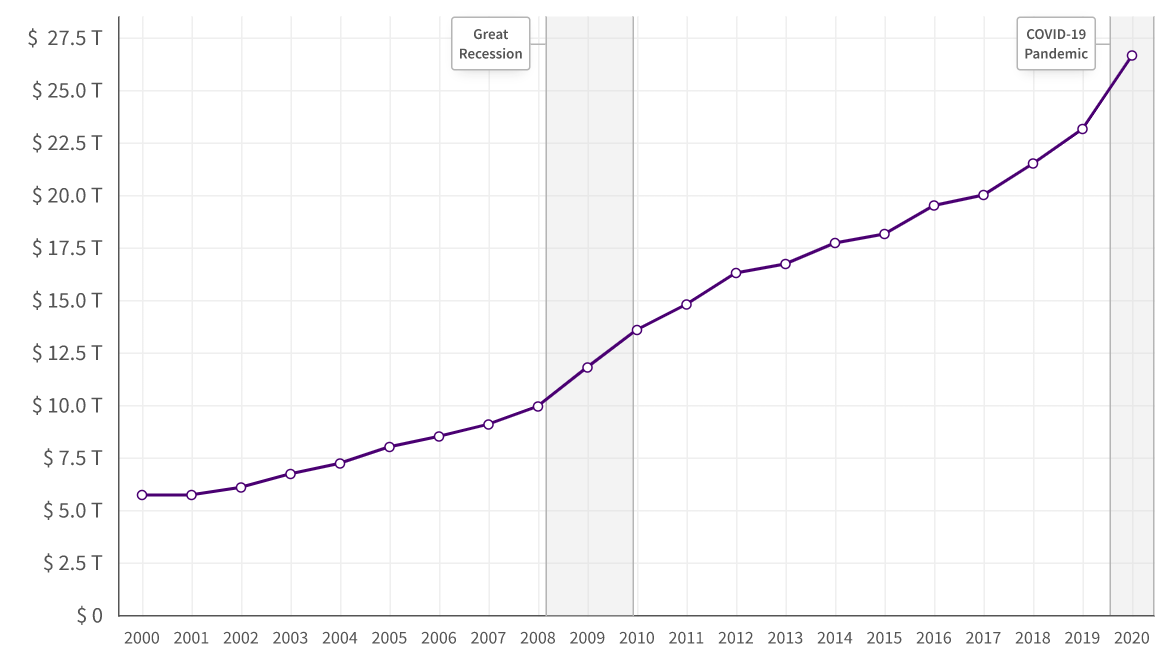
Federal debt current equals $26.95 trillion. I thought about calling it $27 trillion but I didn’t want to be accused of exaggerating (and if you don’t think someone would have accused me of doing so, you are not in my inbox). But the $26.95 trillion is a real number, other than the fact that it does not include unfunded future entitlement liabilities.
This debt was high at the turn of the millennium – a tad over $5 trillion. But it has exploded in the unsettling events of these first twenty years since.
*Data Lab, U.S. Government, June 18, 2021
It’s really not rocket science to attach the news cycle to the above chart and the dollars that go therewith. Two expensive wars pushed numbers up in the first decade. Revenues declined precipitously during the great recession, and spending exploded out of the recession. Oh, and then it exploded again years after the recession (I would love to offer an explanation for this one). And then COVID with $5 trillion of spending packages that created the latest “hockey stick” increase.
But let’s look at a number that arguably means a lot more to us as investors.
*Data Lab, U.S. Government, June 18, 2021
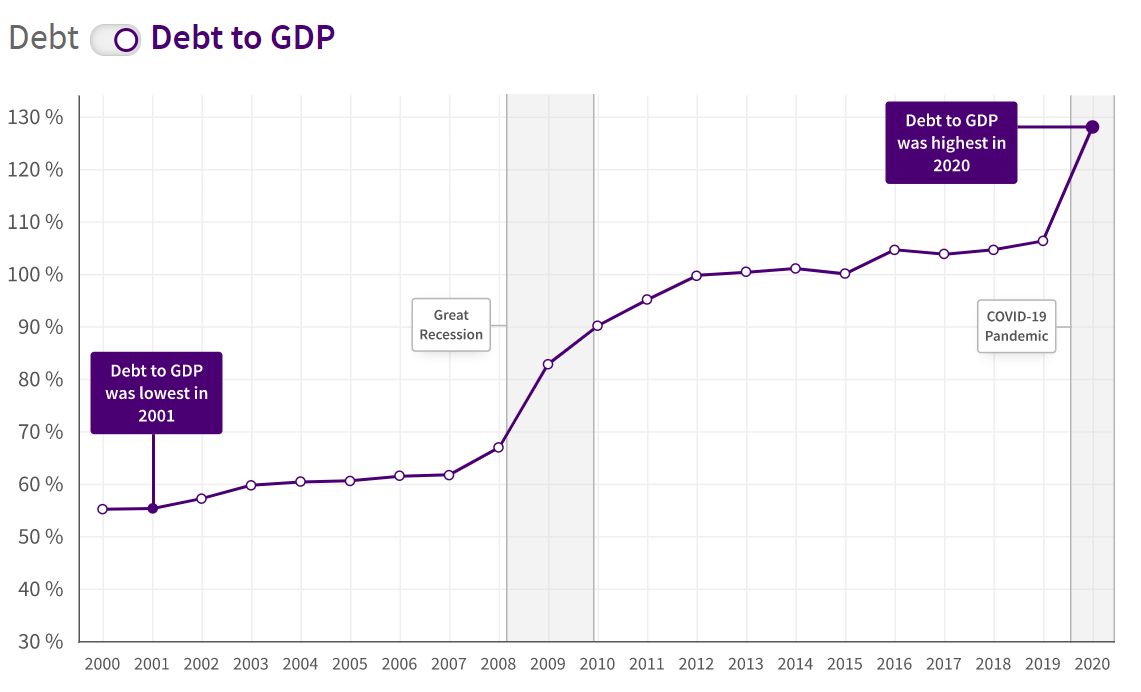
At the beginning of the century, our debt represented 55% of the total GDP (i.e. size of the economy). Where we stand now, it is just a whisker shy of 130% of the size of the economy.
So we have two metrics here – the amount of the debt and the amount of debt relative to the economy’s ability to bear it/service it/etc.
Close but not the same
A very good but not perfect analogy is a household. If we say a family has $50,000 of debt, that is one data point. If we say years later they have $250,000 of debt, that is another data point. But if we then say that when the family had $50,000 of debt they had $100,000 of assets, and when they had $250,000 of debt they had $1 million of assets, those contrasting ratios become very relevant. One could argue the absolute level of debt and even its growth is less concerning for the family at $250,000 than at the lower amount of $50,000 when the assets are worth $1 million versus $100,000.
But in the government’s case, we had .5x the debt to assets, and now we have 1.3x the debt to assets (assets here is being used as a fill-in for GDP; it is not the same thing but I am trying to make an analogy to a family).
If we had 2x more debt than we do it would bother me less if we had 4x more economic size/capacity/resources/assets than we do. It is why I have always believed (well, since whenever I comprehended this concept) that any conversation about debt in a business, household, or nation must be about its ratios to income and assets, not the mere debt itself.
Aren’t you forgetting something?
Oh yeah – the cost of debt! What most people call, the “interest rate.” The cost of debt becomes the extremely important variable in all this, and that importance grows with the size of the debt. I have two proofs for you:
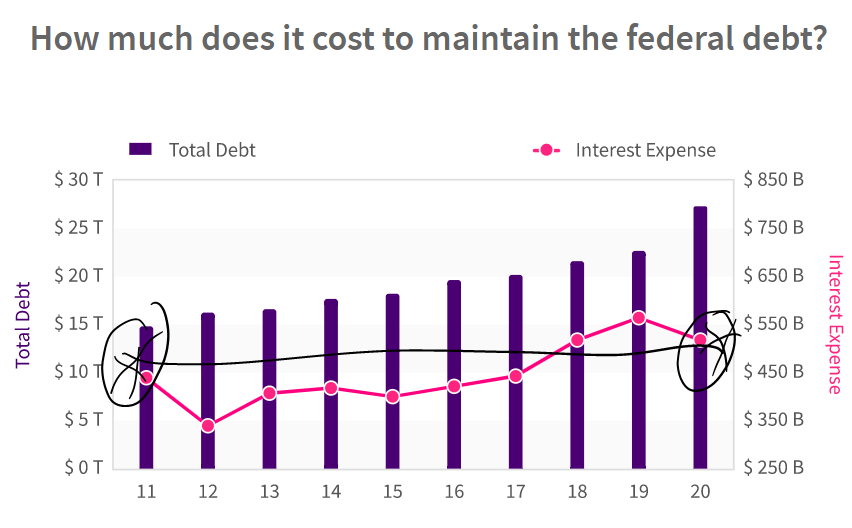
(1) Government cost of debt (interest expense)
*Data Lab, U.S. Government, June 18, 2021
You see here that as the amount of debt over the last ten years has essentially DOUBLED, the COST of that debt is pretty much totally FLAT.
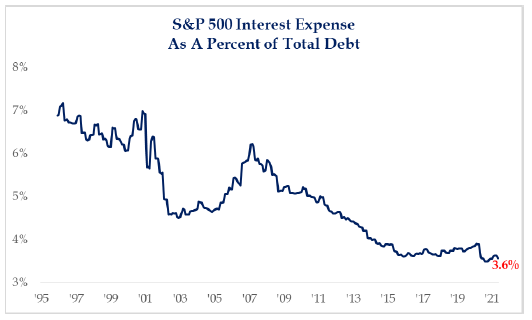
(2) Corporate cost of debt (interest expense)
*Strategas Research, Daily Macro Brief, June 11, 2021
The cost of debt in public equities divided by the amount of debt is basically the lowest in history. But the interest expense itself is meaningfully higher:

*Strategas Research, Daily Macro Brief, June 11, 2021
So interest expense was $130 billion ten years ago, and is $190 billion now, an increase of 46%. But earnings were $57 per share after the financial crisis, $84 per share in 2010, and will be over $180 this year. In other words, while debt cost went higher by 46%, the earnings supporting that debt are up 215%, and even if you cut out the post-crisis immediate years, up over 100%.
Moving us forward
What I hope you see so far is:
(a) that the cost of debt becomes incredibly important when debt levels are rising, and
(b) the level of debt is important in the context of the assets and income and resources and so forth that support it.
And on those two sentences hinge EVERYTHING going on right now. Everything.
All the mistakes and nuances and details
If the S&P 500 has a lower debt-to-earnings ratio now than when it had half of the debt it has, why do we care about the amount of the corporate debt?
Because earnings can go down, you may have heard.
If the cost of servicing the S&P debt is low enough to keep it all manageable, why do we care about the debt level?
Because the cost of servicing the debt can go up, you may have heard.
But the nuance is more important – what the above two risks also do is exponentially increase the risk around those two dynamics, and therefore incentivize policymakers, even more, to use totally new criteria in their decisions.
The system becomes inherently riskier when it is even further dependent on a low cost of capital. This is not a statement about the cost of capital; it is a tautological statement about the embedded risk.
Corporate debt vs. Government debt
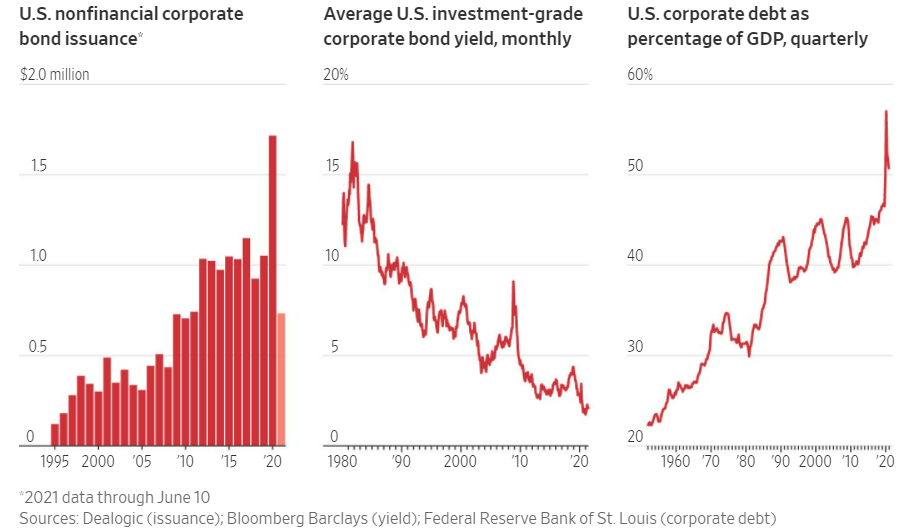
The U.S. added $5 trillion of debt since the pandemic, and corporate America added $1.7 trillion of bond debt alone last year. But it is entirely true that I do not see the two things the same.
I see a lot of risk in both.
I see growing risks to stability in both.
And I most certainly see a downward pressure in forward growth expectations related to the basic math of both – more of tomorrow’s growth pulled into today.
But I still see a difference between excessive government debt that is non-productive to the economy, versus corporate debt that has enhanced productivity. This ought to be intuitive.
So what’s the beef?
The problem is: doesn’t corporate use of debt suffer a diminishing return at some point? How could it not? Isn’t there a marginal reduction of benefit as the debt levels rise and use of debt rises and opportunities to deploy debt are reduced? After good companies and operators max out their use of debt to productively grow, who is left to use debt for productive purposes? Bad companies and operators?
Once the good companies have done their part with leverage and growth, who else benefits? Zombie companies. Debt-loaded goners who have a low return on capital kept alive only by their cost of capital.
This stifles growth, innovation, and productivity. And it makes a mockery of capital allocation and resource allocation. It does not look like a bomb went off. It does not feel like pandemonium. It just drips on and on, delivering totally unacceptable inferior results below our economy’s potential and below our society’s potential.
Why we care about QE
The discussion on quantitative easing is one of the silliest things I have ever seen. No one believes it is actually helping the U.S. economy. No one believes it is leading to more bank lending. And it can’t plausibly be said to be impacting interest rates, either. So why are they doing it?
Because that heavy lubrication of financial credit markets is not just a boon to corporate actors anymore – the financial system now relies on it. As we saw with credit markets in late 2018, inadequate liquidity in the system is incompatible with the heavy dependency on debt and credit in the economy.
And so things like QE get talked about as a policy tool, but not talked about in the context of what it is – a creature of the reality we now have.
Conclusion
None of this is said to be critical as much as it is said to be realistic and sober. High debt and high debt ratios lead to a high reliance on the persistence of the same. Low rates become more important to the risk profile of the economy than they were with less debt accumulation.
More fiscal and monetary response is needed to solve for the high debt problems.
More fiscal and monetary response exacerbates the high debt problems.
Once you wrap your arms around the simultaneous truth of those two sentences, you understand the key issues of the modern economy.
Chart of the Week
I focused this week’s Dividend Cafe on governmental and corporate debt for a reason. But let’s look at households for a second. $14.6 trillion of debt now versus $12.8 trillion before the crisis and $11 trillion at the low level. BUT, debt-to-assets are MUCH lower than prior peaks, because, well, asset values have gone up higher than debt levels have. Simple enough, right? Sort of. On one hand, it is categorically different, and a good thing. But it does beg the question – are policymakers all the more cornered into protecting asset prices (homes and stocks). You tell me.
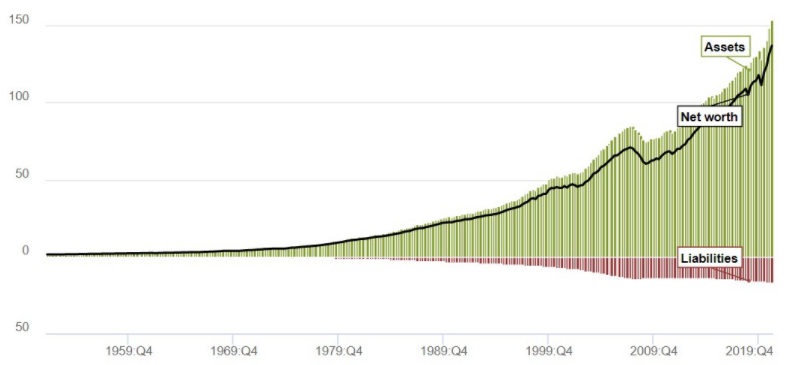
*Federal Reserve, A Wealth of Common Sense, June 18, 2021
Quote of the Week
(this week, I pulled four quotes from the greatest intellect on financial markets debt I have studied the last thirty years)
“Debt isn’t good. Debt isn’t bad. For some companies, close to zero debt is too much leverage. For other companies, nearly 100 percent much higher levels of debt can easily be absorbed.”
“The right time for a company to finance its growth is not when it needs capital, but rather when the market is most receptive to providing capital.”
“All of us, particularly as we get older, try to eliminate risk from our lives. In the United States, as we’ve matured as a nation, we constantly have attempted to eliminate risk. We want the government to take care of various things for us, protect us from changes in the weather, from interest rate changes, from unemployment, etc. The sad thing about risk is that when you eliminate risk you also eliminate the future.”
“The past is always triple-A. We can all remember what the past was. But if we try to make the future triple-A, we have no future. The future is always single-B.”
~ Michael Milken
* * *
I know it was a lot to chew on this week but it is an important subject. Reach out if you wish. We work to answer your questions.
And Happy Father’s Day to all you dads. When my father passed we had $3 trillion of national debt, so we have almost gone 10x in the 25.5 years he has been gone. But when he was born, we had 130% debt to GDP like we do now (right after the war), so maybe there’s hope. He certainly was a man of hope. And so am I.
With regards,
David L. Bahnsen
Chief Investment Officer, Managing Partner
The Bahnsen Group
www.thebahnsengroup.com
This week’s Dividend Cafe features research from S&P, Baird, Barclays, Goldman Sachs, and the IRN research platform of FactSet


