Dear Valued Clients and Friends –
This week’s Dividend Cafe is a long and juicy one – lots of topics, lots of practical subjects (see list below), and plenty for the wonky types and those who loathe such verbose diversions. But what is most important to me in this week’s Dividend Cafe is that it addresses the issue I believe is most necessary for grown-ups to deal with in this day age: The reality of trade-offs.
At the heart of what I think we are dealing with as a society with COVID is the inability or unwillingness to accept trade-offs between risk and reward. The same can be said to our view of government spending. Of economic growth. We have tough decisions to make, and there are opportunities and challenges in making them, and there are opportunities and challenges in not making them. Adults know these things.
Right now, we are living with this reality as investors (and there is a chart that demonstrates this vividly for you today) – interest rates being offered on “safe” investments have, in just ten years time, become a tiny fraction of what they were at the start of the last decade. We can lie to ourselves about a risk-free investment offering us 6%. Or we can believe they will all come back to normal. Or we can deplete principal. We can do a number of things. But we can’t hide from the reality that trade-offs will be a part of economic decision-making (grown-up living) for the rest of our lives.
At The Bahnsen Group, we prefer to take on what we consider to be manageable and known risks in exchange for the needed income levels our clients need. We customize how this is done client by client. The rules are changing for us, too, because the “safety” bucket of a client portfolio is no longer what it was. We have to adjust. What we can’t do is pretend it is all the same. There will be trade-offs.
So let’s explore what all this means this week in a very special edition, of the Dividend Cafe …
In this week’s Dividend Cafe we will:
- Recap the week that just was in markets
- Make the case for a market change in the near future – not one defined by all going down or all going up, but rather one defined by a shift in leadership, away from the popularity group and into the more fundamental group.
- Set the table for a “two-act play” around how we evaluate the economy – the lockdown recession and recovery from such; followed by the “aftershock” phase that deals with structural ramifications from that first phase
- The burden of where rates are now and where they have been
- Ask what has happened to oil prices in 2020, and why!
- Take a look at what the real issue I have with bonds is as I look out into the future
- Note the threats hanging over FANG
- Look at what to expect out of the earnings season that begins this week
- Ask where are we with the U.S. dollar, and what becomes the more investible equity space when the dollar declines? The answer may surprise you.
- Provide a little history on the quarters and years that follow strong quarters. It’s rare to get such universally compelling data.
- Provide our weekly economic report card of the good, bad, and ugly out there, with a special look this week at manufacturing, services, air travel, and more.
- Do Politics & Money (as always)
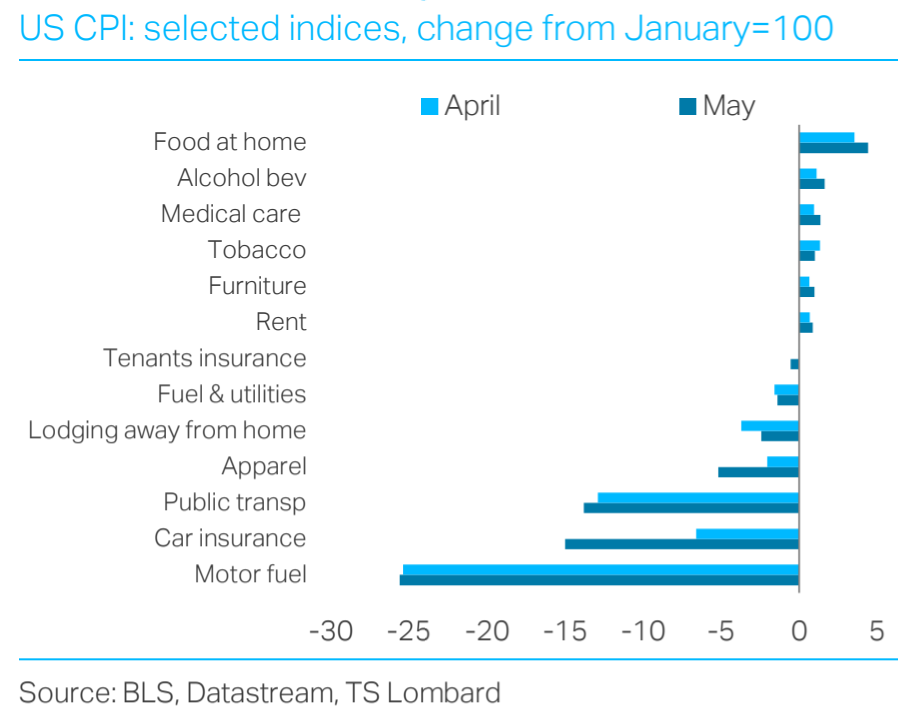
- And in the Chart of the Week, let you decide if we are inflationary woods, or a deflationary jungle
Market week recap
As I am typing Friday morning the market is not yet open but futures are pointing flat at this very moment [since publication, markets went up nearly 400 points Friday leading to a week of net-net + ~300 points]. But coming into today, markets are close to flat on the week (down ~100 or so). This comes with a +450 point day Monday, -400 Tuesday, +200 Wednesday, and -350 Thursday, so while the net net movement on the week is minimal, the day by day volatility remains quite elevated.
What is moving the markets? Volatile markets don’t need reasons and they will not provide clear explanations. Is it fear of COVID cases? If so, how do we explain last week’s +800 points, and the two days this week that were +650, all in the face of growing cases? Is it election fears? Why the back and forth volatility day by day (I assure you the polls aren’t bouncing around, so why would markets be)?
The answer is that it is all of the above – economic data, Fed liquidity, COVID, election, etc. And all of these things have good, bad, and uncertain embedded, so markets stay range-bound, and bounce up and down in search of more clarity.
This has been our perspective for over a month and will remain so for the rest of the year. It will punish market timers, and it will reward dividend reinvestors.
What animal captures this market view?
Is it possible to be neither a bear nor a bull, yet believe that there is some really negative things on the horizon for many investors, and some incredible opportunities for others? I don’t know what animal serves as a metaphorical hybrid of a bull and bear, but I do believe that market outlook is increasingly sensible.
What I refer to is the possibility (and I am fine calling it a probability) that there will be a shift in market leadership in the coming quarters. Timing these things is impossible, but my view is that what has primarily led the market will run out of gas (very high P/E tech stocks with very high market caps), and yet the market will find new leadership, likely with currently under-appreciated “old-economy” type names.
The “new economy” names are not going anywhere. I am not bearish on their brands, earnings power, or market share. I am simply referring to the popularity component that has driven their valuations to levels vulnerable to a pinprick. Should some re-pricing enter the fray for this genre, I am merely suggesting that it doesn’t mean already-discounted stocks not part of this fad have to go down, too. The lesson of history is that a shift in leadership is more likely than a continued slump for both.
A two-act play
I am more and more on the side of my friends at Strategas Research that we are dealing with two different business cycle dynamics here, not just one. The first was the recession of Q1/Q2 that was a direct result of the lock-downs and all of that shock & awe from almost overnight suppression of economic activity. But the “aftershock” from all of that will really have to be thought of as a separate cyclical activity, and it is that dynamic we are entering now, and it is that dynamic that I believe is very different to intelligently forecast. The permanent vs. temporary layoffs that come out of this “phase two” will be one of the most important economic variables in the months ahead. And the stubbornly high weekly jobless claims along with decelerated re-openings are another reason we believe the feds are going to a fourth stimulus package in the weeks ahead.
The burden is real
What makes an investor stay invested with uncertainty? How has the burden been elevated that retirees currently face? Why do I believe in dividend growth as I do (as both a growth and income strategy)? We have taken a surreal hit to “safe” income creation in just a decade. It has changed everything. Decisions have to be made.
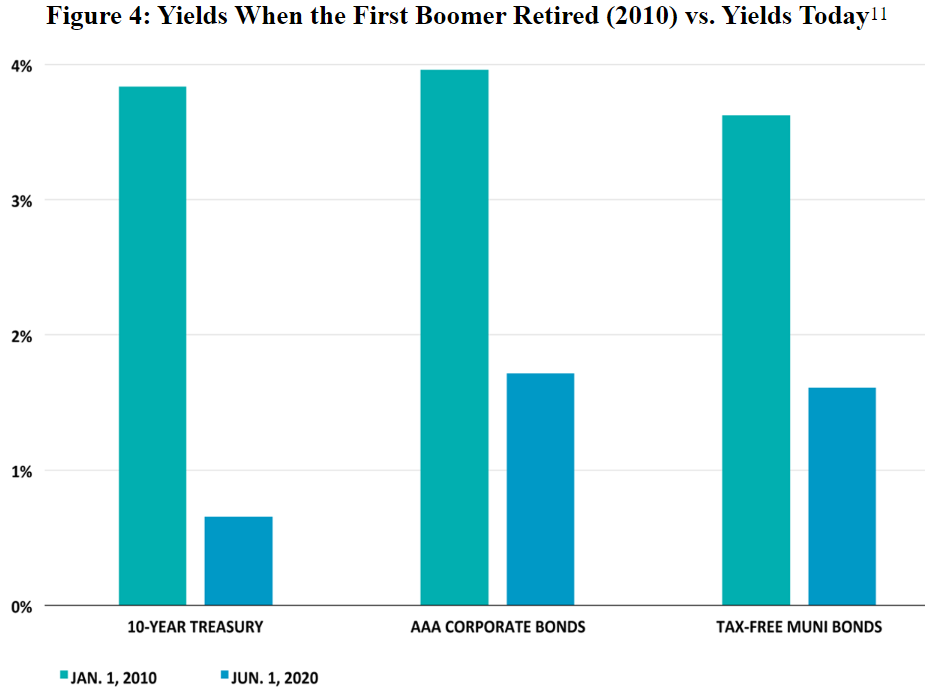
* Blackstone, July 2020 Essay, Joe Zidle, p. 4
America loves a comeback
Oil prices came into the new year near $60 and began declining before COVID hit. But even from a $50 base, the collapse to $20 when Saudi and Russia announced their production war was a sight to behold, and the demand erosion of the COVID lock-downs put the possibility of sustained $10-20 oil prices on the table. I have drawn a red line below at what I think is a more rational bottom on oil prices this year (roughly $15), as that extra little stint into negative territory for one delivery day was not a reflection of oil prices but a reflection of storage costs in a delivery date rollover (pure technical jibberish).
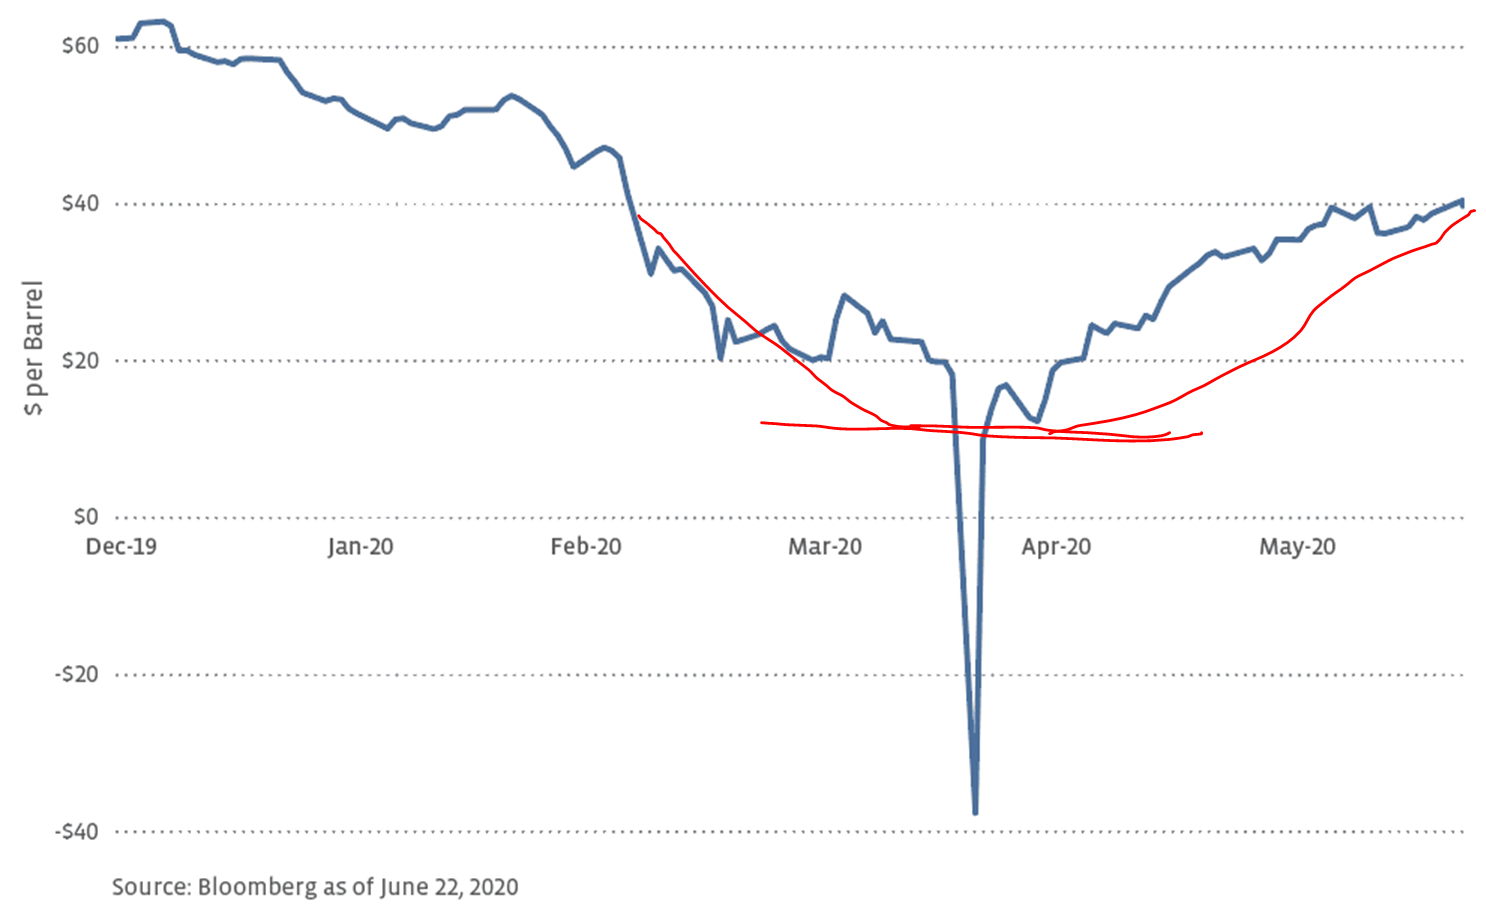
Three factors explain the move back to ~$40 oil from lows around $20 …
(1) OPEC+ supply curbs led by Saudi/Russia
(2) U.S. production reduction led by market necessities
(3) Demand levels bottoming at the max level of shutdown and slowly but surely beginning to come back online
The volatility of both supply and demand realities is most felt in the upstream sector of U.S. energy markets (exploration and production). In the midstream space (transportation and storage), you have some spillover effect from supply/demand realities, but they are muted to some degree by the relevance of volume over price, the industry’s fee-based business model, contract features that seek to mitigate price risk, and an overall more stable cash flow generation that we have long found to be a reliable source of dividend income.
What is your deal with bonds?
For decades, the duration of bonds provided a “barbell” offset to equity volatility – when true volatility and shock hit stocks, the safety of long-dated bonds was inversely correlated and became a great hedge for asset allocators. And there wasn’t a huge cost to the “hedge” because the asset class offered some sort of yield carry that paid investors. The duration-to-yield ratio for high grade corporate bonds right now is the highest in history, and it is almost 4x what it was in 2008 (coming out of the great financial crisis). We are not so much worried that long-dated bonds won’t do well in periods of extreme distress; it is that they won’t make any money in the other 99% of investment periods that the market isn’t in severe territory.
The Fed’s diminishing return
I have been struck all week by this comment from the recent FOMC meeting minutes:
“Several participants remarked that declines in the neutral rate of interest and in term premiums over the past decade and prevailing low levels of longer-term yields would likely act as constraints on the effectiveness of asset purchases in the current environment and noted that these constraints were not as acute when the Committee implemented such programs in the wake of the Global Financial Crisis.”
This does not mean the Fed’s programs are not boosting markets, and it does not mean they will not continue to. The issue here is not risk asset prices, which assuredly benefit from Fed action because of (a) Liquidity, and (b) Compression in the risk-free rate that serves as the reference comparison for all assets. The issue is the real economy.
But but but …
One can believe (as I do) that there is a diminishing return effect in Fed policy, but that does not mean the Fed would not try to over-compensate that effect by trying new programs (Yield Curve Control?), bigger programs, more aggressive ones, etc. than the ones creating the diminishing return!
Falling off the mountaintop
The four or five companies that have stood atop the market for quite some time now, and have continued to grow in such a position throughout this COVID moment, may seem invincible to investors now. Such is always the cruelty of this inevitable lesson – the longer something that is unsustainable persists, the more it draws in, and the more sustainable it feels.
But my belief in an end to bubbles is not merely rooted in the 400-year lesson of history. There are fundamental factors that end bubbles – there are catalysts. This present dynamic is not in the same category of tulips and bitcoin, because big tech (like Florida condos in 2006), has plenty of value – it is simply a matter of dislocation between price and value. But what could be a catalyst to ending the leadership moment these four or five companies presently enjoy?
The first and most obvious (and by the way, one which would likely apply to two or three of them but not all of them), is a government pin-prick to their “monopolistic” advantages (I use quotes to avoid making a legal argument, and more a practical one). I can hardly imagine this not happening at some point. Another option is simply a new shiny toy. I know it seems impossible now, but the belief that no new object will grab the attention of investors because of the current ones is a fallacy so lacking in historical reality, it scares me. Finally, there is always the “exhaustion” factor. At some point, investors just plain quit bidding up the valuations. Remember, this group of companies has seen their earnings double over the last five years, but the valuations are up 5x, not 2x. So the real driver is not organic growth in profits but elevated valuations applied to those [growing] profits.
I have no interest (or ability) in timing when this ends. I have significant interest in understanding the history of bubbles and intelligently navigating through risk and reality.
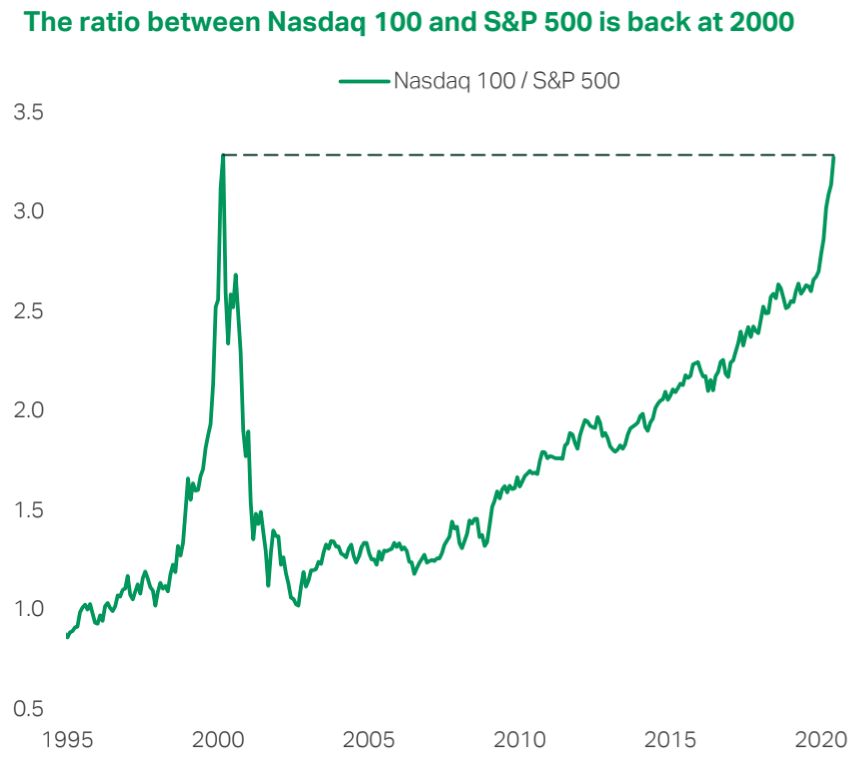
* TS Lombard, July 2020 Chartbook, p. 18
Earnings season awaits
It is always the case that stock prices move more in earnings season around the company’s forward projections than their backwards reporting, though I expect it is more true than ever for the Q2 results that will begin being reported next week and rather heavily for the next four weeks. This earnings season already had 170 companies from the S&P 500 “suspend guidance” (i.e. they did not provide a forward look into what they expected for the convoluted second quarter). I am not sure how many companies will resume guidance for the remainder of the year out of this quarter, but getting more guidance that is more rooted in fact than speculation will be useful. Other than that, multiples become increasingly a by-product of monetary policy and earnings estimates become (if we’re being honest, a shot in the dark) highly vulnerable to a wide margin of error. I am eager for the day when our fundamental analysis is more rooted in cash flow projections, but I am skeptical that this quarter will be the one to provide such rational visibility.
Dollar watch
Is the U.S. dollar set to finally re-price a tad lower? Note the chart here, and how it shows these two things: (a) That the dollar has recently dropped, and was unable to mount a comeback after its late May drop, but that (b) We really have just run in place year-to-date (the blue line shows the starting point and ending point are basically the same, even as there has been plenty of movement below and especially above the line year-to-date).
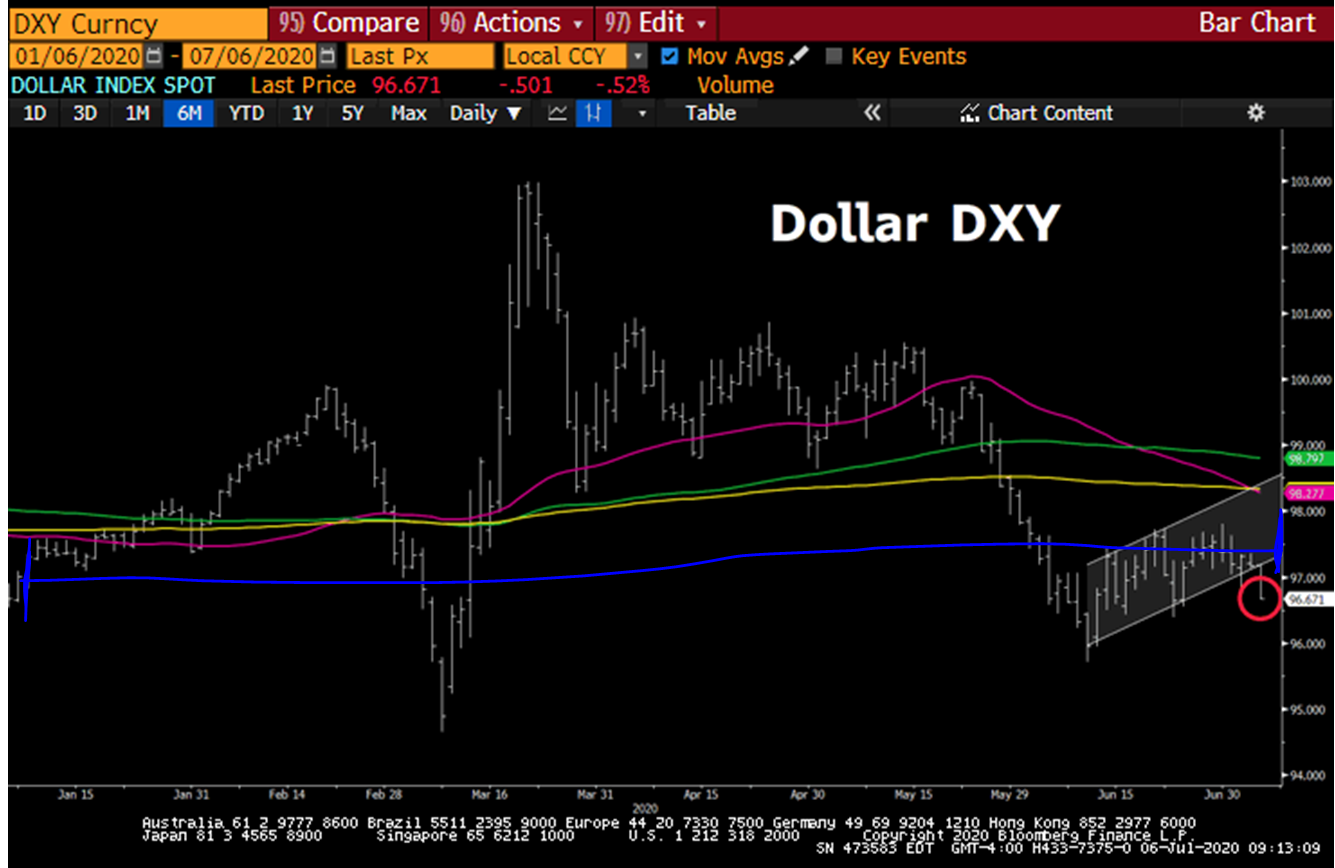
* Bloomberg, July 7, 2020
What if the dollar is declining?
Should investors re-align to European or Japanese or Australian or Canadian equities if the U.S. dollar is to weaken much from current elevated levels? Actually, over 30 years of history says it is Emerging Markets that receive that return premium, by a wide margin …
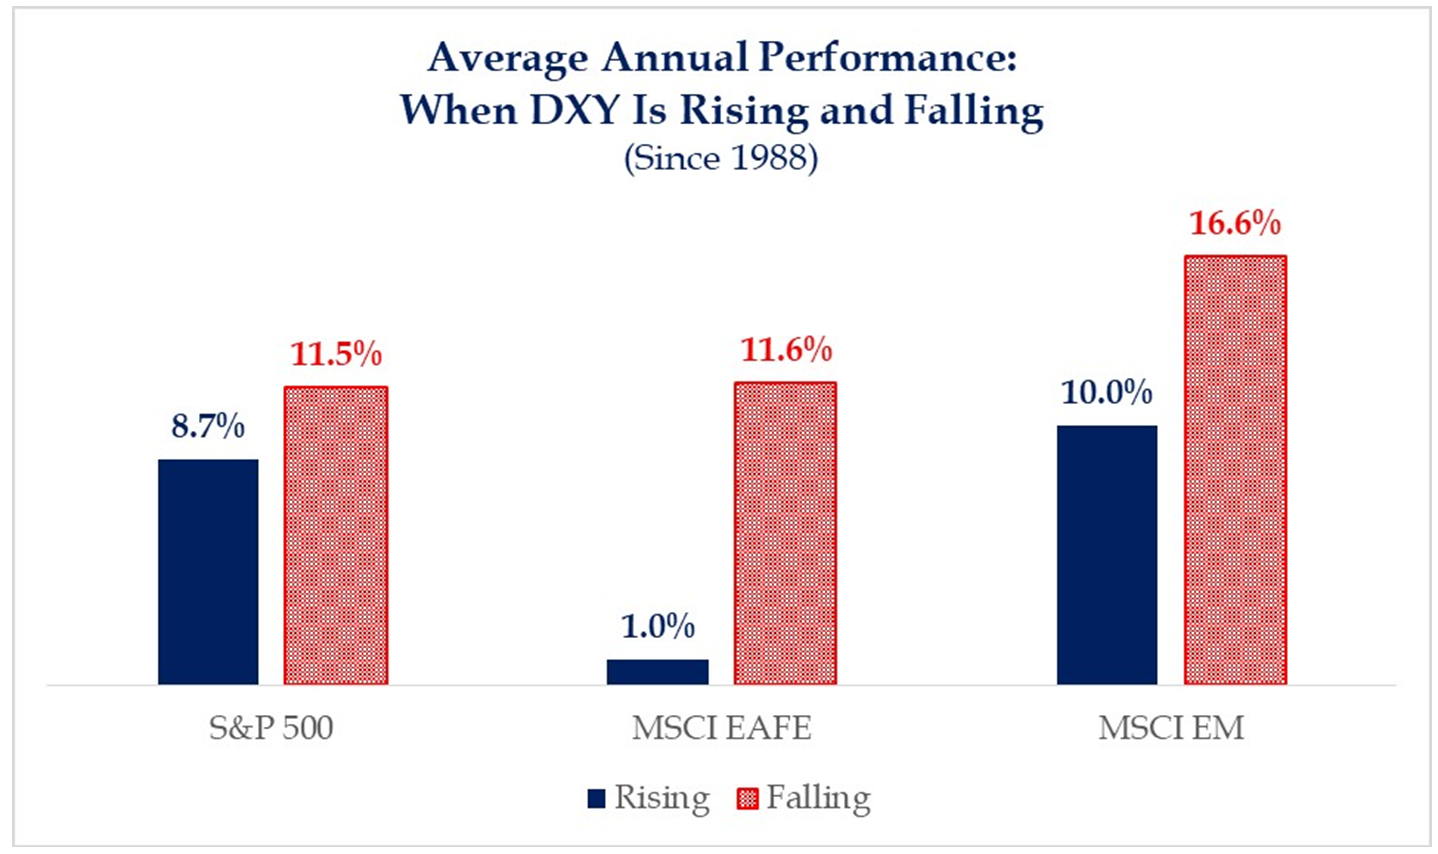
* Strategas Research, Daily Macro Brief, July 7, 2020
Eleven in a row?
The market had one of its top quarters of all time in Q2, and this week we studied the ten best quarters in the market since 1950. It turns out the S&P 500 was up again in the following quarter ten out of ten times, with an average gain over those ten quarters of 8%. And one year later the market was up nine out of ten times … Does this mean the market is assured to be up in Q3 this year, let alone a year out from now? Of course not. But it is history that is worth studying that at least disproves a contrary theory.
Economic report card for the week
That the June PMI Manufacturing returned to expansion mode is a surprise, but new orders (a leading indicator) pushed things higher substantially and impressively.
But then the June ISM Non-Manufacturing number (so services) moving to expansion mode, substantially so, was a surprise, as the figure was expected to come right in around 50 (which is neither expansion nor contraction), and instead came in at 57.1. Business activity index surged higher (to 66, from 41), and overall this was the largest monthly increase in history for the services sector. Yes, it was coming off a total meltdown in May – but either way this snap back was really substantial.
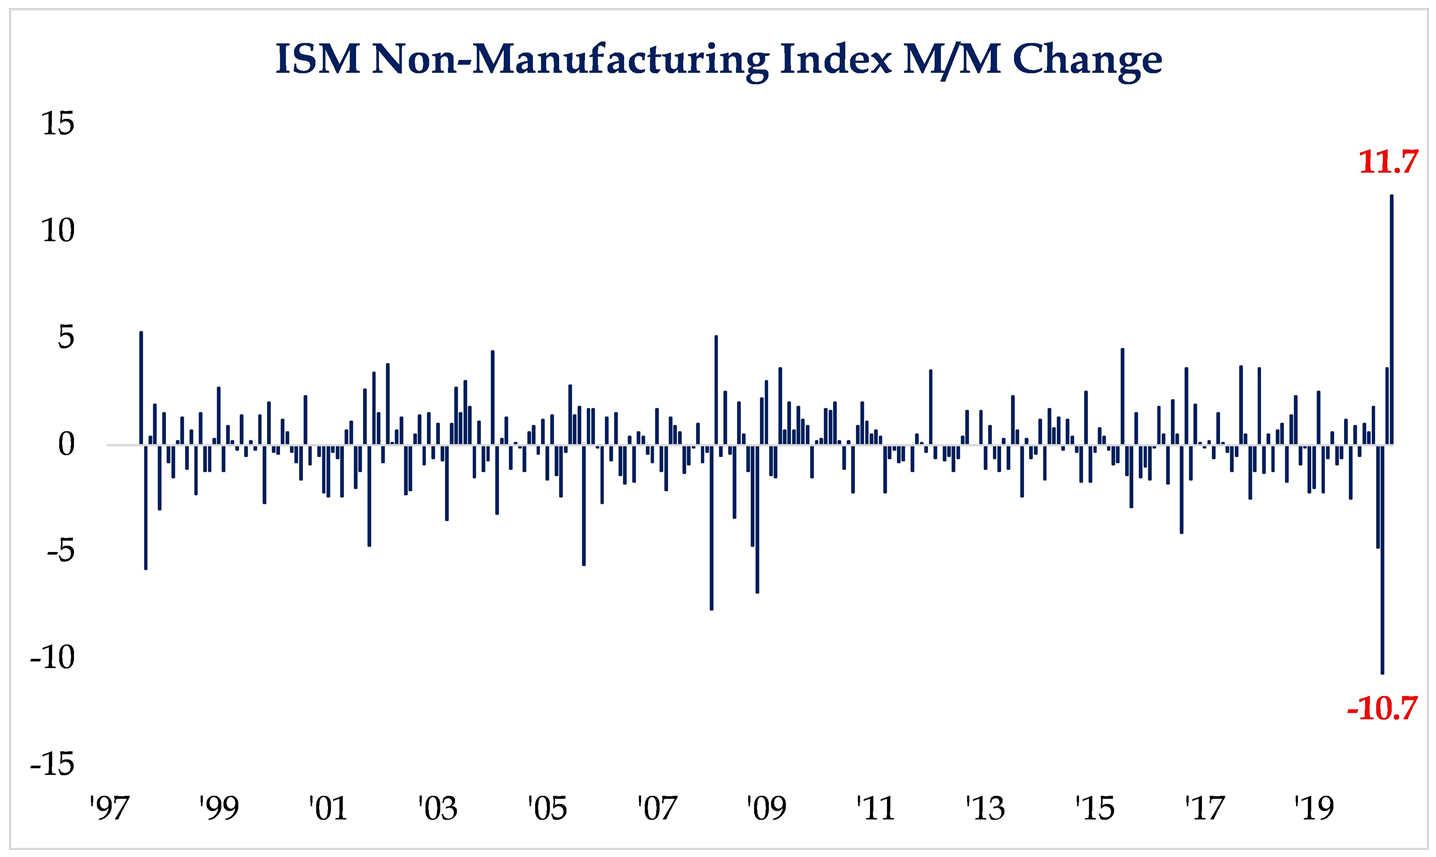
* Strategas Research, Daily Macro Brief, July 7, 2020
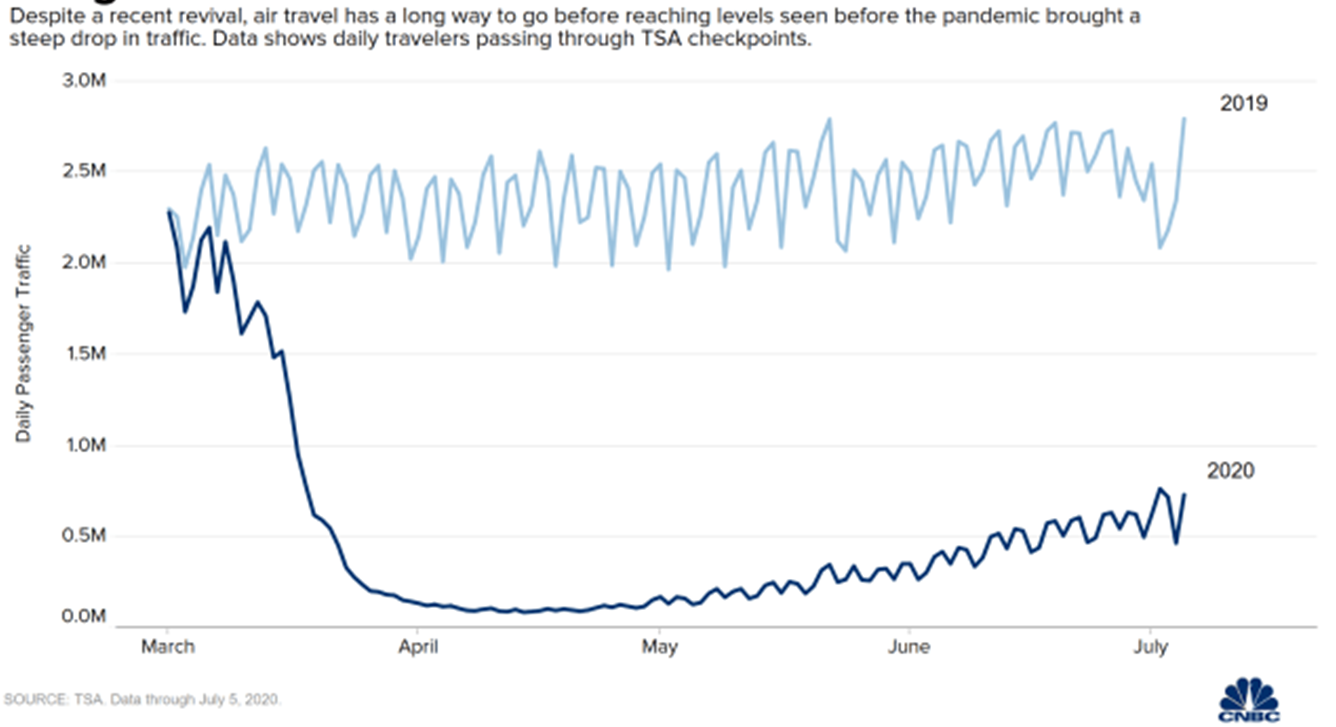
The air travel number remains a big indicator of where we are and where we need to be going. 350,000 daily travelers at the end of May turned into 764,000 daily travelers in early July, an increase of over 100%. However, as the chart below shows, we remain 70% below last year’s trendline, which will not 99% any longer, is still quite severe.
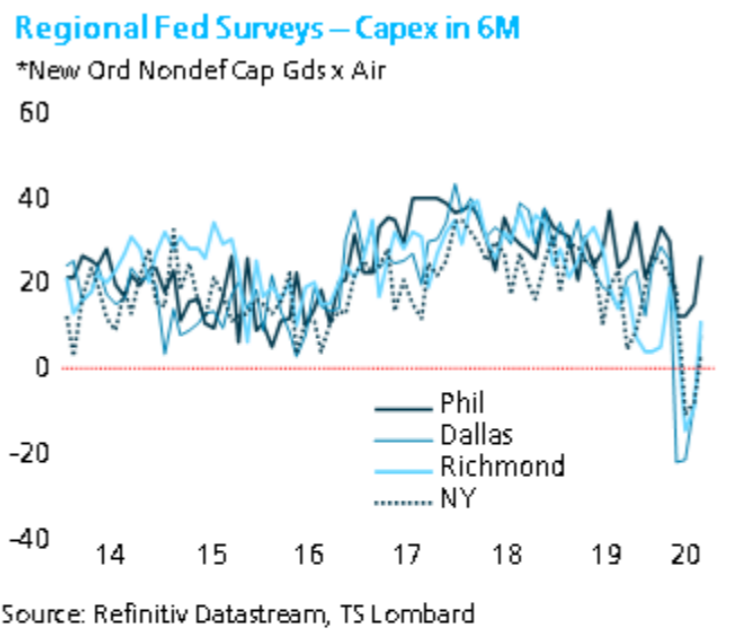
The area I most care about for 2021 and beyond is capex, and I at least like what companies are saying they will be doing in six months …
Politics & Money: Beltway Bulls and Bears
- Presidential front-runner, Joe Biden, gave a speech in his childhood hometown of Scranton, PA yesterday to release a sketch of his economic vision. The broad vision was mostly platitudes – “investment in jobs,” “clean energy,” “innovation” etc. But the word is that more detailed plans are coming over the next five weeks.
- This is the weekend I plan to really dive into my research and writing project on the election, and broader expectations for what the November election may mean for investors.
Chart of the Week
The reality of price inflation/disinflation coming out of COVID will take months and years to shake out, and in fairness to those predicting great inflationary problems from the fiscal and monetary actions taken by policymakers in response to the pandemic, even they are suggesting a “long-term” inflationary concern – not one that should have surfaced already.
That said, this week’s Chart of the Week provides a little data on the disinflation (some may call it “deflation”) that COVID has produced thus far.
Quote of the Week
“If we wish to be free, if we mean to preserve inviolate those inestimable privileges for which we have been so long contending, if we mean not basely to abandon the noble struggle in which we have been so long engaged, and which we have pledged ourselves never to abandon until the glorious object of our contest shall be obtained, we must fight!”
~ Patrick Henry
* * *
Yes, that was a lot to chew on today. The markets are dealing with the trade-off right now of growing COVID cases and growing COVID therapy efficacy. I vote with the latter. But a trade-off, it is.
Don’t miss our LIVE Zoom call talking COVIDー19 & Markets this Monday at 11 am PT/2 pm ET. Register here.
The entire Bahnsen Group team is here to help you understand and manage your trade-offs, every single day. To that end, we work.
With regards,
David L. Bahnsen
Chief Investment Officer, Managing Partner
The Bahnsen Group
www.thebahnsengroup.com
This week’s Dividend Cafe features research from S&P, Baird, Barclays, Goldman Sachs, and the IRN research platform of FactSet


