Dear Valued Clients and Friends,
I actually hate the title this week, because the word “stupid” really is pretty mean. I try not to be mean because I think it is wrong to be mean (I can elaborate if needed). However, in this case, when James Carville famously said, “it’s the economy, stupid,” in the context of what voters cared about in the 1992 election, he basically created a new adage for how we say that a particular thing is really the thing.
And that is the topic of this week’s Dividend Cafe – the thing in dividend growth investing, and clarifying some important terminology and concepts around the thing. And as you shall see today, the thing is growth of income.
Let’s jump into the Dividend Cafe!
|
Subscribe on |
It’s not you, it’s me
I want to apologize for sometimes using financial vernacular without reaffirming definitions and concepts. I do it a lot but I actually try to be as conscientious as possible because I know it is a problem in our industry. So bear with me as I provide some clarity around basic financial vocabulary and especially the philosophy behind it all. This key distinction is the fundamental value of dividend growth investing and people misunderstand it to their own peril.
A client emailed last week and didn’t think he was seeing the growth of “yield” year-by-year that I talk about in the portfolio. What this client was understandably doing was confusing yield and income.
Vocabulary meets math
“Yield” is a function of math: the income at a point in time divided by the value at a point in time.
If one buys a stock with a $40 annual dividend for $1,000, the yield at PURCHASE is 4%. If the next year, the stock is still worth $1,000 but the annual dividend is $50, the yield then is 5%. That could be a good thing (even though ideally, people probably wish the underlying stock value had gone up, too). But the basic parts of it are either inputs (the current stock price and the current dividend level) or calculations (the dividend level divided by the stock price, known as “yield.”)
Down can be up
But if you buy a stock with a $40 dividend for $1,000 (4%) and then a year later, the stock is worth $1,500 but is now paying a $45 dividend, the yield is now 3%. Yep, the INCOME went up 12.5%, but the yield went down to 3%. In what world could that be a bad thing? No one would ever be unhappy with a stock being up and the income being up, just because the math ratio in that now produced a lower quotient.
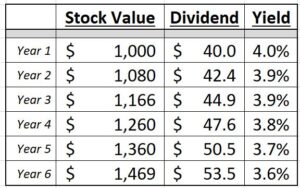
In this easy example here, you have a stock going up +8% per year, and a dividend going up 6% per year. Both things seem like good things, yes? But of course, the YIELD is going down each year (because of math).
Up can be down
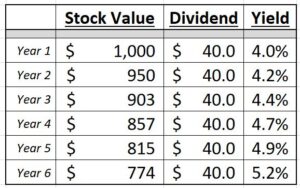
Now here you have a stock going down in value 5% per year, and the dividend is not changing. Both things seem like bad things, yes? But of course, the YIELD is going up each year (because of math).
A realistic scenario
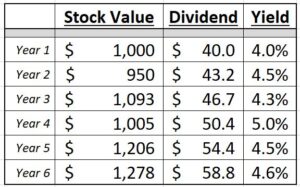
In this case, you see a stock that goes up and down (a few years up, a couple years down), but steady dividend growth of 8% per year. There, the yield is actually higher at the end of the period, simply because the INCOME GROWTH outpaced the STOCK PRICE GROWTH.
The fact of the matter
After a number of years, a company growing its dividend could be the same in price as when you started (less likely since the income is going up) or the stock could be way up (it happens a lot). A company growing its dividend at 6-8% per year will have a yield less than what you started with at the end of a measured period if what?? The stock price has … grown more than 6-8% per year.
Is this all coming together now?
A 4% starting yield sees income grow 6-8% per year and after a number of years the yield is 2.9%. How does that happen?
Math. The value the income is being divided into has gone up. And this is bad, why? Or better yet, this matters why? The VALUE matters. The INCOME matters. The GROWTH of both the value and the income matters. But the math of those things divided? It has no practical bearing on anything. A 10% ending yield can be AWFUL, and at a 2% ending yield can be WONDERFUL. Or not. It simply is not measuring anything of practical value.
Now we make it simple
And this introduces us to the subject of YOI – Yield on Original Investment – the smartest way to measure all of this stuff ever invented.
Let’s look at one of those situations where a stock will go up and down, and the annual percentage movement will never be the same but rather will fluctuate (like all stocks in the history of the world). And let’s have that dividend growing at 6.5% per year. Notice how the “yield” is dropping where the stock is growing faster than the income, and then one year, the yield goes higher simply because the stock price dropped that year, but at the end of six years, a stock that is up 59.2% and has grown its income 6.5% per year shows a yield that went from 4% o 3.4% – all because of math. AND YET, if we just divide the ANNUAL INCOME each year by the ORIGINAL INVESTMENT of $1,000, the YOI – Yield on Original Investment, shows it going higher year by year by year.
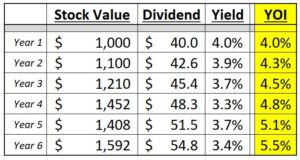
*the above charts are for illustrative purposes only
In fact, many companies growing their dividend 7-10% per year end up with a YOI of 100% after a long enough period of time (I own many; our clients own many; it is math, not miracle management). That means that after a period of time the income annually is equal to or above 100% of the price paid for the stock.
Does that mean you will have a yield of 100%? Well, let’s look at a couple stocks, not as recommendations, but only as illustrations.
We learn from Nasdaq.com and FactSet and Bloomberg, and any reporting metric you want that the stock price of Mcdonald’s in 1988 was $5.25. The annual dividend today is $5.25. So the YOI is 100%. How can a Yield on Original Investment be 100% when one can clearly see that the current yield is 2.25%? Because they have grown the dividend annually 13.63% since 1988, the stock price is up 9.87% annually since then, and the math is the math. What number of all these would a long-term investor care about most?
I’d suggest it is the 100% Yield on Original Investment.
We could illustrate something equally powerful with many other names, but I will spare you the redundancy. I only used Mcdonald’s as an example because I am craving a McRib right now.
Conclusion
At the end of the day, INCOME GROWTH is a dollar-by-dollar metric of what we care about because we put dollars in our pockets, not percentages. And if we need a percentage data point to brag to our friends about, the “YOI” (yield on original investment) is the materially significant one. It speaks to your actual economics. A “current yield” matters at purchase, but a YOI matters in measuring the dollars an investment gave you.
And, of course, all of this is packed into the broader philosophy of dividend growth investing, which speaks to the plethora of mechanical and fundamental advantages we never cease describing, and never cease pursuing. To that end, we work.
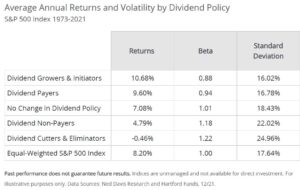
Chart of the Week
Speaks for itself …
Quote of the Week
“It is not joy that makes us grateful; it is gratitude that makes us joyful.”
~ David Steindl-Rast
* * *
By way of quick housekeeping, there will be a full written DC Today on Monday, and Trevor will do a podcast/video DC Today on Tuesday. On Wednesday, we will release a Thanksgiving Dividend Cafe, and then that will be it for the week.
May the fruits of the tree in which you plant investments grow because, in the end, the fruit is all that matters.
With regards,
David L. Bahnsen
Chief Investment Officer, Managing Partner
The Bahnsen Group
www.thebahnsengroup.com
This week’s Dividend Cafe features research from S&P, Baird, Barclays, Goldman Sachs, and the IRN research platform of FactSet