Dear Valued Clients and Friends,
The announcement that total public debt of the United States federal government has now passed 100% of our gross domestic product received a fair amount of coverage the last couple of weeks, but was likely overshadowed for most people by the ongoing Iran turmoil, oil prices, a robust earnings season, and perhaps the settlement of the Blake Lively/Justin Baldoni suit (okay, maybe not that last one, and my hat is off to you if you joyfully don’t even know what I am talking about).
I am devoting this week’s Dividend Cafe to a sober, comprehensive bout of truth-telling regarding the state of our national debt, and I want to explain why. After all, I wrote a full piece on this subject one year ago, and the following week I even added my own commentary on what I would do about it in Dave-land, and then a piece a couple of weeks later on what would happen if we did nothing. I have said time and time again over the years that one of the hardest parts about writing Dividend Cafe is that, as a financial professional, my focus is entirely on long-term realities that matter to our clients, and yet a weekly commentary requires me to address short-term events that others care about more than I do. This topic (our growing national debt) is the most significant and relevant long-term topic I could possibly choose to write about (hence why I do, frequently). And now, with this headline about the debt being greater than 100% of our economy’s size, there is a new “short-term” tie-in that warrants a visit.
So today we are going to discuss the real state of the national debt, how we got here, where it is going, and what it means for investors in the long term. You can try to find an application for the next 20 days or 20 weeks if you wish, but I want to talk to you about the next 20 years. Let’s jump into today’s Dividend Cafe …
|
Subscribe on |
Just the Math
The total U.S. federal public debt sits at $31.27 trillion. This is essentially the money owed to bondholders, so in this sense, you can equate it to “total treasury debt outstanding.” This does not include the money that states and local municipalities owe. States owe about $2.7 trillion, cities and counties about $2.2 trillion, and school districts about $1.3 trillion. But when we talk about the “national debt,” we do not talk about this $6.2 trillion, and for good reason. It is separate and should be thought of as such. But the $31.27 trillion of total federal public debt also does not include roughly $7.7 trillion of “inter-governmental debt,” which is money our federal government owes to other parts of the federal government (namely, the Social Security trust fund). There are reasons in terms of accounting integrity and consistency to NOT include that $7.7 trillion when we refer to “total public debt,” but I just wanted to explain the $31.27 trillion figure when you might often hear a $38 or $39 trillion figure … the delta is that money one pocket of government owes another pocket of government.
But the $31.27 trillion figure is the big one because that is money owed to someone. The “someone” expecting to be repaid (with interest) is individual savers and investors, foreign investors, foreign governments, banks, pension funds, insurance companies, and, yes, the Federal Reserve. More on that last category in a moment … But of the total $31.27 trillion the U.S. federal government owes to bondholders, it is essentially divided up as follows:
- 30% – foreign country sovereign wealth funds and central banks
- 15% – Federal Reserve
- 30% – U.S. households/savers/investors
- 25% – Banks, pensions, insurance companies
Why They Lend and What it Means
The top two categories largely buy as yield-insensitive buyers with a currency or policy objective, and the bottom two categories largely buy as yield-sensitive buyers with a return and liquidity objective.
These holders of treasury debt ($31.27 trillion of such) expect to be paid back. The belief that they will be paid back allows the following things to be true:
- More debt can continue to be issued, even with $31.27 trillion outstanding, because of the faith people have in being paid back.
- The bonds are backed by the “full faith and credit” of the United States, which is to say that they have the ability to extract tax revenue from a big economy. I suppose you could say, along with this confidence of extraction, that the faith and credit are backed by a certain military power.
- The assurance of payment assumed in #1 and rationalized in #2 allows Treasury debt to be used as the “risk-free rate” in all investing – a benchmark for what someone could do with their money if they took no risk, relative to other things that are not risk-free (corporate bonds, stocks, real estate, lemonade stands, etc.). There may be no concept in investing more foundational and important than a “risk-free rate.” And the interest paid on our $31.27 trillion in public debt serves as the risk-free rate by which all of global economics essentially turns. It is daunting to think about how significant this is.
No Melodrama Here
Don’t get me wrong about #3 above. Treasury bills as a “risk-free rate” is an entirely rational concept. We have existed as a country for 250 years, we have never missed a principal or interest payment, we have never been unable to sell our debt, we have a gazillion police and guns, we have the rule of law, and we have a country that has performed better than every other country for a long, long period of time. But none of those things are true, or matter, apart from this one – we have a great, big, robust, dynamic economy.
When a bank lends us money for our mortgages, the debt is as good as our capacity to pay them back (our income, our savings, our character) and the collateral of the house itself. When a saver/investor/foreign country lends the U.S. federal government money, the debt is as good as the economy from which our federal government can extract tax revenue, which is to say that the debt is pretty darn good. If our economy were vulnerable to being taken over by pirates, it would be problematic. If our economy fully depended on one commodity we could sell to some countries, it would be problematic. If our economy lacked robust trade, dynamism, labor, land, and capital, it would be problematic. But savers/investors believe our treasury debt is money good (risk-free) because:
- Our country has committed over 250 years and counting to paying its bills.
- Our government has the ability to extract money from the economy to do so.
- That economy, which is the source of these extractions, is better than everyone else’s.
I have no “but wait” moment coming up. These are all legitimate considerations, they are rational, and it has all worked just fine.
More Math
In the first section of today’s Dividend Cafe, I said our total public debt was now $31.27 trillion. I will now add that our Gross Domestic Product is $31.22 trillion. So when you hear that we have now passed the Rubicon of 100% debt-to-GDP, that is what we are referring to. If 100% of ALL OUTPUT of the entire economy for an entire year went to the national debt, we would not pay it off (and also, everyone would die of starvation).
And as mentioned before, this does not pay back the Social Security trust fund, it does not pay California or Michigan’s borrowings, it does not pay for that beautiful new elementary school they built down the street, and it does not pay for all the bridges, dams, and toll roads.
But it also does not pay for about $85 trillion of social security and medicare commitments for which we have not secured funding. The exact number is incalculable because of how perpetual liabilities are calculated actuarially. The exact timelines for each recipient are unknown, and of course, the exact health care needs of those on Medicare are unknown. But just as insurance companies utilize actuarial processes to provide calculations, we can do the same, and the number may be as high as $150 trillion. I am a low drama guy, so I will just play it cool and call it $85 trillion. So much better!
Now, why now say debt-to-GDP is like 500%, then once you count that “other stuff” (state and local, inter-governmental, and unfunded liabilities)? Because if we are being honest, those things have other levers by which they will be paid than the aforementioned “extraction of tax revenue from the economy” – at least theoretically. The way they charge for Medicare, the rules of Social Security, the FICA rates, state and local tax mechanisms, etc., all play into these other categories of debt. None of them are good, and all of the solutions involve trade-offs that our society would rather pretend do not exist than begin to address. But it is dishonest and melodramatic to treat these things as one and the same with the pure federal public debt. And besides, at 101% debt-to-GDP, we are not exactly singing Pollyanna with the basic nuts and bolts of our bond debt.
How Are We Doing Paying This Down?
As I spend most of my energies trying to explain, if all we had was a $31.27 trillion credit card balance and we were reducing that balance way slower than I wanted, I would be pretty upset. A household with $100,000 in credit card debt that pays as much as it can against the debt each year and sees the balances going to $99,000 and $98,000 could get pretty discouraged. A lot of resources avoid going to enjoyable and productive use when everything has to go to debt reduction, and when that debt reduction feels like it is taking forever, households grow weary (i.e., wage-earners, married couples, families, etc.). That kitchen table dynamic of debt burden is hard enough when “debt is being reduced too slowly.”
But for our federal government, we do not have it so good! No, we spend all of our time debating if we want to add $2 trillion more to the debt, or just a measly $1.5 trillion. Our deficit runs about 6% of GDP, but we are only growing GDP by about 2% (and 2% is a new improvement relative to the 2009-2021 number).
We are not paying our debt down – we are adding to it over a trillion dollars per year, and perhaps as much as two trillion.
But …
This is with no active, declared, ongoing war. Should something like that happen, the deficit goes up a lot.
And this is with no recession, contraction, collapse in profits, collapse in incomes, and collapse in tax revenues. Should something like that happen, the deficit goes up a lot.
Another way to put it is this: As long as we have no economic or geopolitical problems, we will only end up with $50 trillion in national debt by 2040.
Do you feel better?
What Has Caused This Debt? What is Causing These Deficits?
I am going to be as non-partisan and non-ideological as I can be in the next paragraph. The reality is that math should be pretty numerical (you can look that up), and basic numerology should not require much ideology. That said, I am aware of how hard this is for anyone to do without their own political worldview or belief system entering the fray. I think I have been very honest with Dividend Cafe readers over the years that I am a Reaganite conservative to my core, heavily biased towards limited government, fiscal responsibility, and a free enterprise system uninhibited by high taxes and regulation, which could stifle growth and opportunity. Those are my beliefs connected to the vision I have for society. Others have very different beliefs and visions that inform how they would interpret data or desire government spending to go. So while we can all read the same numbers, the fact of the matter is that we carry presuppositions into the data that color the process. My cards are on the table.
With that said, while I loathe wasteful government spending and boondoggle programs, it is not wasteful government spending that has created $31.27 of national debt. I am all for eliminating every single dollar of fraud, waste, and corruption, but I am not for playing dumb and acting like those things created the debt. I make a pretty good living and don’t have to pay attention to every detail of my spending the way most people do (and should). Every now and then, I find out I am still paying for an iPad wireless that I haven’t had in years, or a cable bill from a house I haven’t had in years. The dollars are insignificant to my P&L, but obviously, no one wants to throw money away. Saying “I don’t want to pay for someone else’s utility bill because I forgot to call AT&T” is totally legitimate. Saying, “that bill is the reason someone has $100,000 of credit card debt” is, well, very bad math. In the grand scheme of things, fraud, waste, and corruption are inexcusable and moral blights on our national spending, but they are not mathematically significant.
Nor is it true that our military is the source of our fiscal anxiety. Different people can have different views of what our investment into national defense should be, but in just doing a pure mathematical analysis, our spending in this category is less than 3% of GDP – about 30% the amount of GDP we dedicated to national defense for decade upon decade. About 13% of our federal spending is for defense and military, which is not a small number, but it is a tiny fraction of what it has been over the last 75 years. I will grant that the 85% it was in World War 2 was an anomaly, but it was over 50% in the 1950’s and 60’s, it was 25% in the 1980’s as Reagan finished off winning the Cold War, and it was 18% in the 1990’s. We talk about the post-Cold War years of the Clinton Presidency as a period where he slashed military spending in the aftermath of the Soviet Union’s demise, but even then, it was nearly 20% of spending – dramatically more than it is now. Even in the Iraq/Afghanistan wars of 2001-2011, it was about 20%. And now it has stayed below 15% for over a decade.
We could also say that perhaps the problem is that we are not taxing enough, and many may very well believe that ideologically. Some may feel that the top 1% of taxpayers, who earn about 22% of total income but pay about 46% of all federal income taxes, are not paying enough, and I freely admit I would disagree with that ideology. But when it comes to an objective explanation for the explosion of national debt and annual deficit spending, it doesn’t cut it. Federal taxes right now are 17.3% of GDP, higher than when we had the highest marginal tax rates in U.S. history.
The difference is that government spending is now 23% of GDP, about 30% more than the 17-18% average we had for decades.
Getting to the Bottom Line
I just want to make this as simple as I can possibly can. We used to spend about 17-18% of our economy on funding the government. We ran some deficits, but they were small, and the economy was growing at a faster clip than we were growing the deficits. A lot more of that money went to national defense than does now. The total debt was about 50-60% of the economy. Some people were worried, but it was all pretty contained. And the economy was growing greater than 3% per year net of inflation (even after accounting for the occasional and inevitable recession).
We are now spending 23% of our economy on funding the government, and we are growing deficits more than double the speed at which we are growing the economy. Less of our resources go to military spending than at any point in decades. Total debt is now higher than 100% of the economy. And the economy is growing 1.9% for the last 18 years, just 61% of what it had been from 1946-2007.
Other than that, how was the play, Mrs. Lincoln?
In All Thy Getting, Get Growth
This is generally the part where those who bemoan our excessive national debt and the truly unhealthy trajectory really double down for clicks and book sales. Apply a doom-and-gloom message to all the empirical facts, and let the natural dynamics of fear within human nature serve as a means of monetization.
Sorry, I don’t have it in me. I am not going to conclude with some particular doom-and-gloom prediction of debt default, economic collapse, or bond vigilantism. Any number of bad things are certainly possible, but none of them is the base case, and none of them has had a great track record of materializing as the doom-and-gloomers have called for year after year after year (and, in fact, going back many decades). The number of variables that exist, which could make certain things I have covered today better or worse, is infinite. Predictions about all of this are just silly, and applying timelines to silly predictions is just dangerous.
And besides, I feel investors can focus on the risks of what we do know and come out a lot better than they can by focusing on what we do not and can not know. And here is what I do know.
I am very skeptical that we can solve the entire problem merely with better growth, but I am totally certain that we cannot solve any of it without better growth. Growth is a necessary but not sufficient condition for repair. A public policy portfolio that does not promote economic growth is futile. Period. I can save my recipe for generating such economic growth for another day (though I do have one place I’d really like to start), but it is utterly inconceivable to believe that the fiscal state of our country can or will be fixed without a massive rediscovery of real (net of inflation) economic growth. To our policymakers, I say, “Please work to that end.”
None Dare Call it Austerity
I also am very skeptical that we can solve these problems without some pain, some problems, and some trade-offs. We are mostly living through a period right now where we just tease out how bad it will have to get before we act. We know that the earlier we act, the less the pain will be, but we don’t want the pain now, so we kick the can down the road. It is immature, it is immoral, and it is reckless. And it is going to reap what we have sown for it.
Whether it be social security changes, spending cuts, tax policy changes, or all of the above, this is not going to be solved without a multitude of things that various stakeholders vehemently oppose. And not a single person does not know this to be true.
But for Us Investors
Treasury bonds can still be the risk-free rate, but might I suggest, paradoxically, that the greatest investment mistake people make today is assuming that because debt-to-GDP has worsened and the risk intensified, yields will have to be higher for Treasury debt. That is all true if the buyers were to primarily be yield-sensitive buyers, like savers and investors, and rational economic actors.
But what if the very premise behind the above led to the exact opposite conclusion? What if the issue required a focus on less yield-sensitive buyers, with central banks and foreign sovereign wealth becoming the marginal buyers? Might that create a scenario where enormous pressure exists to push yields lower, commit financial repression, and distort the rational forces of risk and reward in the bond market?
You can say you are not buying it, and that this hypothetical is a stretch. But I guess I would ask you if it is even really a hypothetical, looking close to home or elsewhere?
Growth is a sine qua non of economic life, of solving for excessive debt, and of restoring a political order that values stability and opportunity. Deep speculation may hit some of the growth notes, but it also may fall into the graveyard of speculative manias that have misdefined growth since time eternal. But diversified, rational, repeatable, calculable, sensible, valuation-conscious growth rooted to coherent businesses and defensive business models generating abundant cash flow – well, that is different.
And no one is claiming that dividend growth equities are the new “risk-free rate.” But I will say this – in a country that has 100% debt-to-GDP and in a world where risk is a necessary part of return, you may not find a better trade-off between risk and reward than in such. To that end, we work.
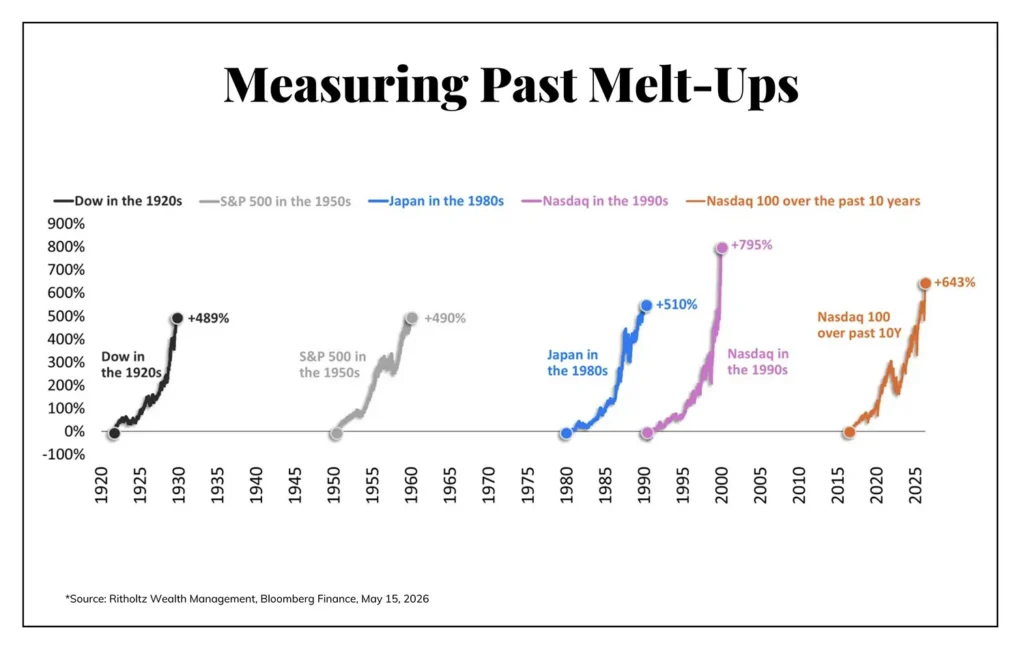
Chart of the Week
This chart from my friends at Ritholtz grabbed me this week. I reiterate that it carries a timing mechanism with it. But I also reiterate that when 99% of people you show this to respond with some version of “this time it’s different,” it really means that “this time is not different.”
Quote of the Week
“To preserve our independence, we must not let our rulers load us with perpetual debt. We must make our election between economy and liberty, or profusion and servitude.”
~ Thomas Jefferson
* * *
I started typing this at 4:00 am today (Friday) and swore I would keep it to 2,500 words. 3,600 words later, I am done. I hope you don’t feel it ran too long. There was a lot to say.
Enjoy your weekends. Stew on this all. And reach out any time. We are living in some serious silliness. And we want better for you.
With regards,
David L. Bahnsen
Chief Investment Officer, Managing Partner
The Bahnsen Group
thebahnsengroup.com
This week’s Dividend Cafe features research from S&P, Baird, Barclays, Goldman Sachs, and the IRN research platform of FactSet