Great Service
There’s this old adage in customer service that says, “under-promise and over-deliver.”
Why? Because so much of happiness, or contentment, is derived from outcomes – how things turn out – being better than what one may have expected.
Imagine the opposite; how does it feel when someone overpromises and under-delivers? Frustrating, disappointing, annoying, arghh! And the list goes on.
Just Like Last Time
Our expectations are often rooted in our past experiences. As consumers, we appreciate consistency. We want that chicken sandwich to taste just like it did last time, and we anchor these expectations more heavily on our RECENT experiences.
One of the most commonly referenced cognitive biases in behavioral finance is recency bias. This bias is our tendency as investors to lean more heavily on recent outcomes to guide future expectations. BUT past is NOT prologue, and herein lies the exact issue that we will address in today’s discussion: investor’s great [misplaced] expectations around future investment returns.
Recent Returns
The last 12 months have been good to the stock market (+33.493%), the previous ten years have been good to the stock market (+16.532% annualized), and the last 100 years have been good to the stock market (+10.845% annualized). I used the S&P 500 historical returns to represent the “stock market” returns referenced here.
As for bonds, let’s check out how the 10-year US government treasury has fared:
Last 12 months = -4.021%
Last 10 years = 1.708%
Last 100 years = 4.881%
Not as exciting or robust, but a clear and noticeable difference between the long-term average (100 years) and the most recent decade.
Anchors Away
So, riddle me this, where does one anchor their future expectations for stock returns? Bond returns?
Most financial planning software will lean on these long-term averages (referenced above) as their default assumptions for future returns. This is a problem. The last hundred years of results is not a good anchor point. Today, interest rates and bond yields are not similar to historical averages, and stock valuations are not similar to historical averages. This financial planning software will then produce a “probability of success” measure. This is the probability that one won’t outlive their nest egg. My concern is that this is a classic overpromise and under-deliver.
So… What would a reasonable person expect for returns from cash, bonds, and stocks? There is no perfect way to forecast returns, and it is nearly impossible to predict short-term outcomes. Still, there are some back-of-the-napkins calculations to help create reasonable expectations.
Cash
Let’s start with cash. We live in a world where savers are punished, and borrowers are rewarded – you get nearly no interest on your savings account, yet you can refinance your mortgage at historically low rates. Sure, you can blame the federal reserve or the government, but this is the reality of the financial landscape we live in today. So, my assumption in the financial plan for cash returns is 0%.
Bonds
Bonds are easy. The highest correlation to future returns for high-quality bonds is the current yield-to-maturity. It wouldn’t be unreasonable to assume that a high-quality bond portfolio in today’s environment would have a yield-to-maturity in the range of 1.5%, which means that my assumed return in my financial plan for high-quality bonds over the next decade would be 1.5%.
Stocks
Stocks take a bit more math. One way we can compare the cost or valuation of stocks today vs. different points in history is to measure the price-to-earnings (P/E) ratio. The P/E ratio tells us how many dollars in a stock price you must pay for every dollar of profits that company produces. Historically investors have paid, on average, about $17 for every dollar of profits (earnings). Looking at forward forecasts of earnings compared to current stock prices, this ratio jumps from 17:1 to something in the range of 22:1. A more rich or expensive valuation means that one should expect a lower future return. An imperfect back-of-the-napkin short-cut for determining a return assumption could be to just inverse this P/E ratio (E/P) which we call an earning yield, and use that rate plus the dividend as a return assumption for stocks. So, 1 divided by 22 equals 4.5% plus the current dividend yield on the S&P 500 of approximately 1.3%, and we get an expected rate of return of 5.8%.
Note, there are many more sophisticated ways to come up with stock return estimates. For example, Research Affiliates concludes that an appropriate proxy would be “Sum of beginning dividend yield, long-term average real growth in EPS, and implied inflation.” John Bogle, the founder of Vanguard, preferred his method of “Starting Dividend Yield + Earnings Growth rate + Percentage change (annualized) in the P/E multiple.” My personal method will get you within spitting distance of these more sophisticated calculations, and that is truly good enough. Remember, financial planning is a game of horseshoes, not a game of darts – we will never hit the bullseye (a perfect forecast), but we intend to get our assumptions as close as possible to the pin.
If you really didn’t like these short-cut calculations, you could just highjack return assumptions from a well-respected research firm like Blackrock. Again, I just want to reemphasize the importance is not finding a perfect prediction but rather having a reasonable expectation that doesn’t solely lean on historical [past] results.
Alternatives
This thought exercise we did reveals some revised return assumptions that are below average. This is an example of why alternative investments have gained so much popularity amongst institutional investors and retail investors over the last decade. When cash has nothing to offer, bonds are lackluster, and one is anxious about piling all their resources into stocks. The treasure hunt begins for alternative sources of returns—another article for another time.
The Times They Are a-Changin’
Now, let’s bring this all together. Fifty years ago, many retirees would lean on their pension to fund their retirement. A pension is a defined benefit plan, where the investor has a defined clear understanding of how much income they will derive from this plan. The onus to meet the commitment of this income obligation is on the pension plan. At some point in history, pension plans became nearly extinct, and they were replaced by defined contribution plans (e.g., the 401(k) plan). These defined contribution plans made the investor responsible for (1) making contributions to build up their nest egg and (2) figuring out how to convert this nest egg into lifetime income.
The defined benefit plan (pension) was easy to understand, and there was a defined amount to be received at a defined future date in perpetuity. Trying to convert a nest egg made up of millions of dollars into a calculation to determine “enough” is a mushy concept. Not to mention the impact of taxes, inflation, market volatility etc., etc., etc.
Target Date Funds
To make matters worse, defined contribution plan providers started to get nervous that there wasn’t sufficient education for investors to really take on this investment management duty themselves. So, these providers sought to come up with a one-size-fits-all solution, and it wasn’t more education (teaching a man to fish). It was the target-date fund. A one fund solution that an investor was encouraged to save into would take care of the rest, leading an investor into a “smooth” landing towards a target-date retirement.
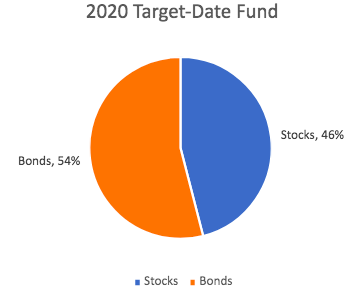
Perhaps those same “average” return assumptions we criticized as the default setting in most financial planning software might be the same assumptions used in creating target-date funds. Let’s take a look under the hood of one of these common target-date funds and see what the allocations look like for a 2020 target-date fund (2020 representing a solution for a brand-new retiree):

For Illustrative Purposes Only
Now, let’s apply our revised assumptions 46% stocks generating a return of something like 6%, with 64% bonds generating something like 1.5%. Before fees, taxes, and inflation, this portfolio could reasonably be expected to return somewhere around 3.7%. Now, is this what the last 100 years would have looked like? No, absolutely not. These returns are muted comparatively. Could the actual results turn out to be better? Yes, absolutely. And I pose this question again, is your financial plan poised to over promise and under deliver or the opposite?
Two Words
I am fully aware that there is a chance that this article could come off as cynical, or it may feel like I am painting this doom and gloom retirement picture. I promise you this is not my intent. I want to leave you with my advice for two different types of investors – the accumulators and the distributors.
If you are in a stage of life where you are still accumulating wealth, I have two words for you: save more. I want to encourage you to “over save.” Stretch yourself. If you intended to save 10% this year, stretch for 12% or maybe you did 12% this year, shoot for 14% next year. Continually stretch yourself to save more. We will never land on the perfect forecast, but extra savings will provide you with a much larger margin for error.
If you are in a stage of life where you are distributing (spending) your wealth, I have two words for you: more volatility. Maybe your grandparents had the luxury of buying Certificates of Deposit (CDs) where interest rates were juicy and attractive – the best of both worlds, stability, and returns. Times have changed, and this financial landscape has a way of pushing all of us up the risk spectrum. We need to strengthen our endurance muscle and prepare our financial gut for the volatility rollercoaster ride. Many distributors could benefit from accepting a bit more volatility in their portfolio to glean a bit more returns in the long run.
Homework
Beyond that, I would encourage you to do some recon into your situation – what kind of returns does your financial plan assume? What does your current asset allocation look like? Is it kosher and aligned with your expectations, or is it time to roll up your sleeves and make some adjustments to match your expectations with the outcomes that are needed for your financial plan?
Now, you have your marching orders, so off you go…


