

Today we are going to discuss what I would label as the most misunderstood word in finance – RISK.
Historically the finance industry has conditioned us to use terms like conservative, moderate, and aggressive to describe our risk tolerance, but I am not sure everyone really knows what those terms actually mean. The word risk is vague. We describe sky diving as risky and poker players say things like, “how much are you willing to risk?” but what does the word risk mean when we are discussing our investments?
Some might brush this off as semantics, but it really isn’t. Your interpretation of risk will be the driving force behind how your portfolio is assembled. Therefore, a misinterpretation could not only be misleading but in the long run, it can be detrimental.
In our everyday life, we are usually using the word risk to describe things that have a binary outcome – win or lose, life or death – but in the world of investing the context is typically different. Sure, if you are day trading penny stocks or you’re an early investor in a venture start-up then maybe the context is the same, but that doesn’t apply to most of us. For most investors, the term risk is synonymous with volatility.
Volatility is the idea that the value of an investment is everchanging because the price is constantly adjusting to whatever the next buyer is willing to pay for it. This uncertainty about the future value of an asset is what causes most of us to cringe. Human beings absolutely hate uncertainty. To help resolve this, some mathematicians decided to provide a way to quantify this uncertainty and provide a historical measurement for how big or small these price swings are. We call this measurement standard deviation.
** WAIT! Don’t bail on me. I promise this won’t get too technical. **
Although that might sound like a scary math term, let’s just break it down and simplify it. The word standard is used to describe the average. When we have an investment, we can look back at its track record and we can compute what the average return is or what we might call the “standard” return. We know that those returns will typically not be the same each year, they will tend to vary or “deviate” from the average. So, the “standard deviation” is a description of how much these returns tend to vary from the average. Simple, right?
Now, let’s take a look at this graphically.
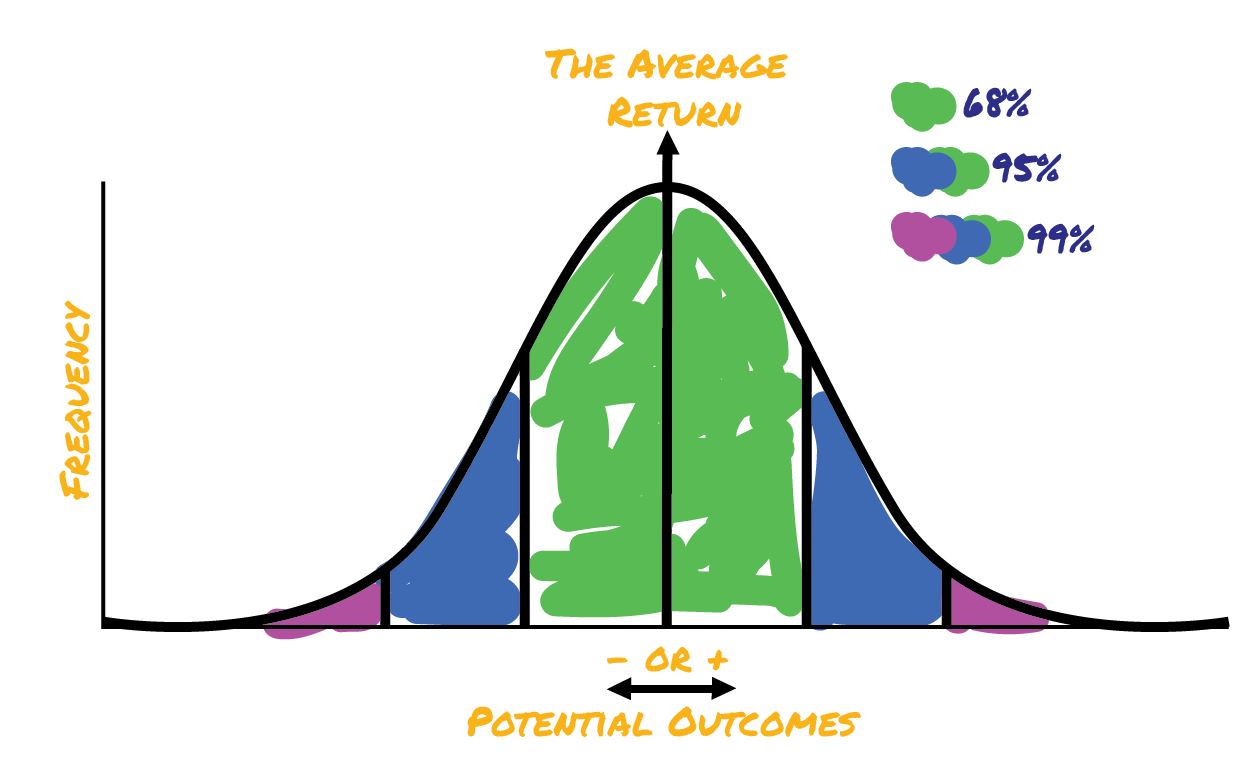
You’ve probably seen this bell curve before, this is what we call a normal distribution. The thick black line in the middle is used to notate the “average return” for our example, but this same illustration could be used to describe average height or average weight. We tend to see this type of distribution all throughout nature, it’s the beauty of math.
Here’s an example, when my wife and I take our one-year-old son to the doctor and they describe his height or weight as being in this or that percentile they are describing where he plots out compared to other babies his age on this distribution curve. If he was the 50th percentile then he’d fall on the center line and he’d be right in line with the average. If he was in the 2nd percentile in height (being very small compared to average) or if he was in the 97th percentile (being very tall compared to average) then he would plot somewhere in the pink area, the tails of the graph. The left-hand side is below average and the right-hand side is above average. Just for the record, my son’s head size is in the 90th percentile, I hope that means he’s smart.
Ok, now back to investing. Here’s how this applies. When you are assessing an investment, you not only want to know the average return, but you also want to inquire about the standard deviation. You want to know what to expect. Remember, you are already stuck dealing with some level of uncertainty, so it’s helpful to know how volatile this potential investment you are assessing is.
So, using our nifty graphic above let’s discuss a hypothetical. Let’s say you have an investment that has an average return of 6% and a standard deviation of 10. Assuming a normal distribution, we see that the green shaded area accounts for 68% of the potential outcomes, so 68% of the time this investment should be expected to be +/- 10 from our average of 6. Said another way, a majority of the time (68%) returns will be between -4% and 16% (that’s just +/- 10 from 6). The blue shaded areas and the pink shaded areas are described as 2nd and 3rd standard deviation events, they are less likely to occur. The pink shaded area may only occur around 4% of the time.
Ok, now let’s bring this full circle. I started our discussion with this claim that most folks don’t really understand what risk means when it comes to investing. Here’s why; most of us will tend to frame risk in those binary terms that I mentioned and assume that each investment will either go boom or bust. The reason I wanted to take you a bit deeper into the math is that I want you to understand that risk is actually just a measurement of varying outcomes. The wider the dispersion of potential outcomes, the greater the uncertainty or said another way, the greater the risk.
When you and your advisor design a portfolio, you should design it with this in mind. Think of the standard deviation like guard rails around your portfolio and build a strategy that stays within the guardrails that you are comfortable with. Remember, as these guardrails get wider, meaning you are willing to accept more variation then typically the average expected return should increase as well. This is the risk/reward relationship that we often reference.
Here’s the moral of the story, the reason I want you to understand risk is because I don’t want you to be surprised. Surprises are what frustrates us, surprises are what cause us to make irrational and emotional decisions. If you begin to look at your investments in terms of probabilities of potential outcomes you will not be surprised when the outcomes vary because this is exactly what you expect them to do.
I’ve met countless investors that tell me how they’ve sworn off stock investing because of a bad experience in the past. Most of these bad experiences resulted from a lack of diversification or a misunderstanding of risk. Remember, in order to achieve what we described as an average or standard return, you need to stay invested for a long enough time to let those averages play out. If I was to flip a coin three times and it comes up heads all three times, would it be safe to say that going forward it will be heads 100% of the time? No, of course not. We understand that we need a large enough sample size for real averages to play out.
I do understand though. If investing was foreign to me and I started off assuming that I will get average and then my first outcome is negative, I’d be pretty disgruntled too. The natural response to this is to shift assets into something that doesn’t have varying outcomes, something I might deem as “safe” or “conservative.” And this is how many investors begin to accumulate a surplus of cash.
Now, we could write a whole other article on the risks of being heavy-handed in cash, but let’s keep it simple. The reasoning behind most investing is to preserve and grow your wealth. The things you can purchase with your cash will naturally get more and more expensive each year (inflation), so the longer this cash surplus sits, the less buying power you’ll have. But if you understand risk now and you understand varying outcomes, you should feel more comfortable about allocating your investments more wisely.
From here, I will hand this conversation off to you and your advisor. You two should take a review of your portfolio and make sure everything aligns well with your plan and your expectations. Who knows, maybe now that you have a better understanding of risk, maybe there are some adjustments to be made.
And that’s it for today. Feel free to email any questions or comments to . Until next time…