Dear Valued Clients and Friends,
I have a view of where the United States is in its economic cycle that I have had for quite some time, and that has substantially informed many of the macro assumptions I bring to portfolio management. I have shared this overarching worldview many times over the years in Dividend Cafe and elsewhere, and I am constantly refining it, analyzing it, and even challenging it.
It has the word “deflation” in it, though I really believe the term “Japanification” is a better encapsulation of my perspective. “Deflation” is often associated with “depression” and no one in their right mind believes we are in another “great depression.” And of course, the boom of inflation that we saw in 2021 and 2022 did not create a lot of discussion about the threat of deflation (like worrying about freezing to death in a heat wave). But temperatures do get very cold in the same places that they get very hot (I just made up that analogy right there). And as I have written before, there was nothing in the 2021-22 inflation that remotely contradicted my macroeconomic thesis.
So what I want to do today is re-hash the greater macroeconomic view that I believe properly frames our perspective at The Bahnsen Group. Some history is needed, some updated data, and some general understanding of what is making this road to Japanification tick. I promise it won’t be boring.
Okay, I don’t promise it won’t be boring if you are still reading, desperate to get to some juicy tabloid gossip. But if you are still reading because you need a little more E-conomic talk and a little less E! Channel in your life, then you have come to the right place. Let’s jump into the Dividend Cafe …
|
Subscribe on |
Two nations, two paths, one common theme
The nation that first Japanified in the developed world was, wait for it, Japan (if you got that wrong, I would recommend you re-study that other master riddle – “how many companies are in the S&P 500”). It would take a five-part Dividend Cafe to write about the asset bubble of 1980s Japan that really preceded the deflationary generation that followed. And many books have already been written about what has transpired since.
The United States has taken a different path to our soft Japanification and has a lot of things going for it that can’t be ignored by an honest analyst like myself. Perma-bears suffer from an intellectual dishonesty (worst case) and a sociological blindness (best case) that misses the caveats, but I will be careful to not let that happen.
Paging all economists willing to engage
There is nothing I have encountered in my adult life that compares to the unwillingness to intellectually engage quite like economists and analysts on the lessons of Japan. On a nearly daily basis, someone will say, “government spending is always inflationary,” then the counter-factual that Japan has the highest debt-to-GDP ratio in the developed world with the lowest inflation will be offered, and the response is … a blank stare. On a nearly daily basis, someone will say, “central banks running obscenely easy monetary policy always creates inflation.” A response will be offered like, “Japan has run negative interest rates or the zero-bound for ages and created quantitative easing as a policy tool, and they have had no inflation,” and the response will be … crickets.
An insult taken as a compliment
This is not to say that excessive government spending can’t be inflationary, because it almost always is (until it isn’t). The three words in the parentheses are the whole point. It is not to say that reckless monetary policy can’t be inflationary, because it most certainly can be (until it can’t be). That was four words. The entire point of Japanification is not to say that money printing and central bank magic tricks, and government money creation is not inflationary; it is to say that it runs into a law of diminishing return and then goes the other way. What inflationistas always and forever fail to understand is that inflation is what these people want to create! One is not insulting them to say, “you spent so much government money and now we have inflation!” The entire economic system more or less goes like this:
(1) Spend a lot of money on something you believe you need after borrowing the money to do so
(2) Pay back the borrowed money with inflated dollars
(3) Rinse and repeat
Paying back $1 with $0.60 cents is very, very good math for the borrower. But the creditor will not take $0.60 to satisfy a $1 par obligation, so one has to give $1 that is worth $0.60 cents to pay back the $1 that way. That is the miracle of inflation. Now, it isn’t really a “miracle” as much as it is a “moral atrocity,” since it erodes the standard of living for an entire society, most regressively those of lower incomes, but still – it’s pretty clever.
There are some catches. What you are doing with the excessive government spending probably needs to most benefit those who are most hurt by the diminishing purchasing power of their dollar, or you may create an uprising (the transfer payment system in the U.S. has helped to politically counter-act the inflationary realities for a long time). And you really need to keep the number between 2% and 4% (maybe 5% soaking wet, but that is probably too high). A 3% inflation level results in dollars that are paid back 24 years later worth just $0.50 cents from what they were when you borrowed them, and it is small enough that people don’t really feel the pain all at once in a way that infuriates them. But 6%, 7%, 9% – watch out! Pitchforks and all that stuff. People who haven’t opened a history book since 4th-grade start saying “Weimar” a lot, and those who do not know if Argentina is in Africa or South America start saying “Zimbabwe” a lot.
But inflating away debt is what politicians exist to do.
And avoiding the fatal impact of debt-deflation is what central bankers exist to do.
And I say all this without an iota of conspiracy theory or tin foil hats. This is just plain indisputable history and economics.
At some point the next drink doesn’t add to your buzz
It was Irving Fisher who taught us the quantity theory of money (MV=PT), where money supply X velocity equals the price level X the supply (transactions) of goods and services. The re-ordered equation is that P = MV/T (the price level equals the money supply X velocity, divided by supply.
It was Milton Friedman who taught us that Money X Velocity = Nominal GDP. There are, out of this basic concept, complexities around liquidity, interest rates, and prices. To the great Milton Friedman, an increase in the velocity of money would prevent interest rates from dropping when money supply was rising, skewing the monetarist belief that increased money supply would stimulate spending and income. And if he believed that rising velocity would keep rates from dropping as money supply increases, it behooves us to understand how the exact same principle works in reverse … As the great Lacy Hunt has taught us:
“Rising income will raise the … the demand for loans; it may also raise prices, unless the velocity of money falls sharply.”
Velocity cuts both ways. Period.
Milton Friedman quite literally said:
“Let the higher rate of monetary growth, unchecked by velocity, produce rising prices, and let the public come to expect that prices will continue to rise. Borrowers will then be willing to pay, and lenders will then demand higher interest rates-as Irving Fisher pointed out decades ago.”
The last 25 years in Japan and 15 years in the United States have been a case study in a failure to understand the caveats about velocity that we were given.
Keeping this simple
This is part of my weekly writing where I force myself to not drown you with charts about the correlation between money supply and deposits at commercial banks (hint, it is airtight, and both levels have collapsed in the last six months). I am resisting the temptation to show you obvious the correlation is between bond yields (long end of the curve) and velocity is. I simply want you to empirically understand:
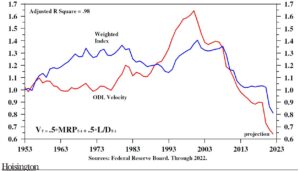
The GDP (economic output) we get per dollar of debt has collapsed, and the level of loans we have at banks relative to deposits at banks has collapsed, and those two things are the textbook definition of velocity.
Okay, I lied. You need a chart. Velocity of the money supply (red line) and its correlation to loan demand combined with the productivity we get on our debt (the two things are blended in the blue line) correlate in a way that is unmistakable this side of Vienna.
Bringing it back to pre-COVID and post-COVID
What I am suggesting is that the massive levels of debt taken on in Japan to cure the hangover of their asset bubble burst resulted in a collapse of velocity.
What I am suggesting is that the massive levels of debt taken on in the United States (and Europe) to cure the hangover of their asset bubble (and to feed their unquenchable desire for more social spending) resulted in a collapse of velocity.
And the results were as obvious as can be post-GFC into the COVID moment, at which time trillions of dollars of government spending, a flood of Fed activity to support that fiscal endeavor, and a complete collapse of supply created a violent interruption to the state of affairs. Now, the economy is re-opened, we are done exploding M2 (money creation, which is actually now negative), excessive monetary sugar is done (and wasn’t doing a da*& thing stimulatively anyways the last 12 months the Fed kept it rolling), and the supply chains of our domestic and global economies are essentially normalized (or at least normalizing).
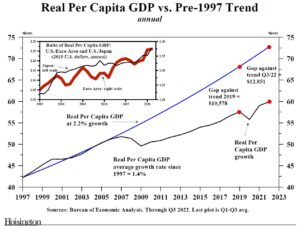
And yet, the debt is there. Collapsing loan demand is there. A pitiful savings rate is there. And yes, low velocity is there. Ergo, downward pressure on bond yields re-surfaces and soon enough, more fiscal and monetary booze goes into the fiscal and monetary punch bowls (it ought to be considered one punch bowl for our purposes). The impact on economic growth from this debt and spending is microscopic. Standards of living drop. And we live with brutally sub-par economic growth compared to what we have been used to as a developed, successful, capable, resourced, and resourceful nation.
But we’re different than Japan!
Indeed we are! That was true in the 1990s and 2000s and it was true post-GFC. And it is true today. We are more economically productive, and we have different trade dynamics, and we have better-capitalized banks, and I can go on and on and on. I do not suggest we are identical to Japan.
I suggest that our debt dynamics and diminished return reality of fiscal and monetary stimulus are directionally the same.
I also suggest that a massive source of structural advantage over the last 30 years was demographics. Japan had an aging population. We had a booming population. They had no kids. We had lots of them. They had a decreasing amount of “peak productive adult age” people; we had a gazillion of them.
And now, we are throwing that structural advantage away.
Deflating by age and mortality
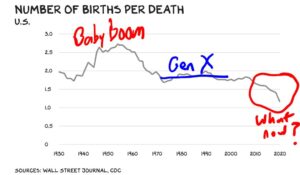
The U.S. population grew +0.4% last year, which is nearly zero. China, on the other hand, declined by 850,000 people, which was its first net decline in over sixty years. Countries no less significant than Japan, Germany, and Italy all saw negative population growth last year, and are in a negative population trend. Current demographic trends suggest over twenty countries seeing their populations decline by 50% in the next generation.
The challenge of declining fertility is not only the math of mortality (80-year-olds are closer to death than 5-year-olds, so if you have more old people and fewer young people, you are creating the preconditions for a declining population due to mortality; this is sort of obvious). But there is a significant problem here with productivity, as well. Yes, alive people are more productive than dead people (I know we all know some people who buck this trend, but hear me out). But generally speaking, 40-year-olds are more [economically] productive than 80-year-olds. If today’s 30-40-year-olds are having less kids, that means that when today’s 40-year-olds are tomorrow’s 80-year-olds, we will have less people in the productive zone (40) than we do in the less productive zone (80). Make sense?
I can leave as a mere postscript another un-ignorable reality here … We will have even less workers feeding the premium dollars into the entitlement programs (social security and medicare) that even more workers are withdrawing from. Because, math.
Baby boomers outside the office?
With a H/T to Scott Galloway, the sociological trends don’t look set to create more babies any time soon.
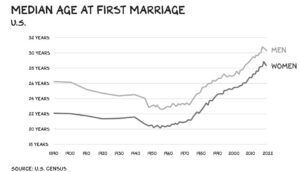
(I assume you understand that the older one is getting married the less babies they are likely to have, in terms of societal aggregate realities; we used to call this the “biological clock” metaphor, but I do not know if we are still allowed to talk that way or not; it is hard to keep track).
The “baby boomer” phase is no more. The question is how low we go, and whether or not (and when) we reverse.
A global phenomena
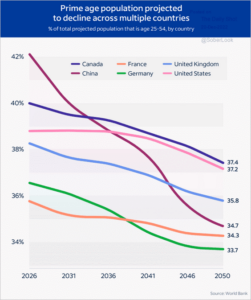
And it is not just the U.S. losing prime productivity merely from age demographics. The portion of the population that is 25-54 is collapsing in all large countries. Exporting one’s deflation becomes harder in this condition.
Good vs. bad deflation
No one complains when the price of an MP3 and MP4 player that can play 10 million songs and videos is 1% of the cost of a 1984 VCR. And indeed, as Louis Gave has written:
“Capitalism is a profoundly deflationary system, if only because every company boss wakes up each morning wondering how his or her organization can get more efficient—whether by using fewer workers, smaller amounts of material or less capital. It is this very impulse to do “more with less” which ends up driving most economic progress.”
I sincerely wish that were the type of deflation I was talking about – greater efficiency, greater productivity, and doing “more with less.”
Unfortunately, Japanification is none of those things. It is stagnation. It is financial repression.
We can debate what defeated the monetary inflation of the 1970’s all we want. Was it the tighter monetary policy of Paul Volcker? Was it the supply-side economic growth of the Laffer-Kemp-Mundell-Reagan revolution? Was it the de-unionization of much of America’s workforce? Was it the strong domestic energy production that began in the United States in the 1980s? Was it the early innings of globalization and China’s participation in the world’s economic community? Could it be that it was some combination of all these things? I am quite sure it was an “all of the above” situation, and I am quite sure that the supply-side growth of the 1980s does not get enough credit, and the Volcker rate hikes get too much credit.
But regardless, history is clear that we had real inflation in the 1970s, and a true moderation of such in the 1980s and 1990s.
And then …
In the 2000’s U.S. debt was exploding, and then in 2008, it hit the classic debt-deflation spiral we call the Great Recession. A credit contagion led to a massive contraction of the economy as over-indebted households and companies had to de-lever, and the balance sheet of government was used to avoid the debt-deflation spiral whereby asset prices are dropping faster than debt can be paid down with those very assets. So the world did not end and a ton of bad debt was “liquidated” and the balance sheet of Uncle Sam was allowed to stand in for the balance sheet of a lot of the household sector for a while.
So good. The world did not end. right?
The problem was what came next. Sub-par economic growth. 1.6% real GDP output vs. 3.1% historical average. A divorce from trendline reality that has not been recovered. And why can’t the world return to normal right now? If you ask people like Lacy Hunt and me, it is because the productive capacity of the economy is hampered by a transfer of economic activity from the private sector to the governmental sector, and because the monetary policy tools of the Fed put downward pressure on growth, investment, and innovation (less savings = less investment = less productivity = less growth). And because capital allocation has become less optimal due to Fed interventions. And because debt hangs over the future in a way that disincentivizes confident investment into the future.
This is Japanification.
Conclusion
Is it fatal? Not necessarily. Japan is still there and is a reasonably happy society. But as some begin to accuse the current disinflation of being “transitory” (sound familiar?), too many will miss the forest for the trees. When we are done talking about the price of eggs (which we should be talking about!), we will need to be talking about where our trendline growth went.
And the only country that may know the answer is in the land of the rising sun.
Charts of the Week
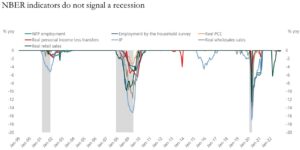
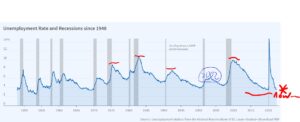
Just in terms of re-visiting last week’s recession topic, it seems to fair to show the decline in a host of economic and employment metrics in past recessions, versus where we are now. And I think the second chart is an even better illustration of my 2002 analogy. The unemployment rate is way too low now to be recessionary contrasted to past recessions, yet the one “mild” one we saw was … 2002.
*Apollo, Daily Spark, Feb. 1, 2023
Quote of the Week
“What great cause would have been fought and won under the banner, ‘I stand for consensus’?”
~ Margaret Thatcher
* * *
May you all enjoy your weekends. Risk investors and risk-off investors likely feel good about the start of 2023 (stock and bond markets), and yet we know the things that linger over us. I get the focus on the outlook for 2023, and I am all for living in the moment. But I am paid to worry about 2033 and 2053, too. To that end, we work.
With regards,
David L. Bahnsen
Chief Investment Officer, Managing Partner
The Bahnsen Group
www.thebahnsengroup.com
This week’s Dividend Cafe features research from S&P, Baird, Barclays, Goldman Sachs, and the IRN research platform of FactSet


