This week I was working on a financial plan with another advisor at The Bahnsen Group, and we got into a conversation about sequence-of-returns risk (SORR). I was reminded of how important this topic is yet how little is known about it. While we’ve mentioned it in previous TOM articles, it deserves a dedicated observation of its own.
So, with that introduction, let me now present to you today’s SORR subject… Sorry, I had to do it; I can’t pass up a good pun 🙂
Bingo
Have you ever played bingo before? Even if you haven’t played, I am sure you’d be familiar with the typical scene. The Caller in the front of the room spinning a basket of ping-pong balls, picking out one at a time, calling out one letter-number combination at a time, and then lining up the chosen ping pong balls in a row. All the while the folks participating in the game are stamping their own bingo sheets as the numbers are being called.
How would you describe this collection of numbers in a game of bingo? They are random, right? They definitely are not predictable; they don’t reflect any pattern, and are as unique as a snowflake.
Investment returns share a similar trait. They have an element of randomness to them. We look at history to gain perspective and context around the risk attributes associated with different investments and their potential returns, but the year-by-year results indeed cannot be forecasted with a high level of accuracy or consistency.
Take the S&P 500 for example; the average (geometric) return over the last 91 years has been 9.49%, including dividends. Based on that average, one would assume that typical returns for the market on a year-to-year basis would be between 8% – 12%. Surprisingly though, over the last 91 years, there have only been four occurrences where the market return for a year was actually between 8% – 12%. That’s less than 4.5% of the time.
What can we conclude from this? The sequences of investment returns are unpredictable.
Accumulation vs. Distribution
This randomness associated with the sequence-of-returns possesses a risk for investors.
This risk is most prevalent during a key phase of the investing cycle – the distribution phase.
Imagine someone is preparing for retirement. Whether they are 40 years from retirement or 40 days, their objective is still the same – to accumulate the necessary amount of wealth to retire comfortably. The day that individual retires, this objective shifts from a focus on accumulation to a focus on distribution with the primary focus being to not outlive your money.
SORR Accumulation
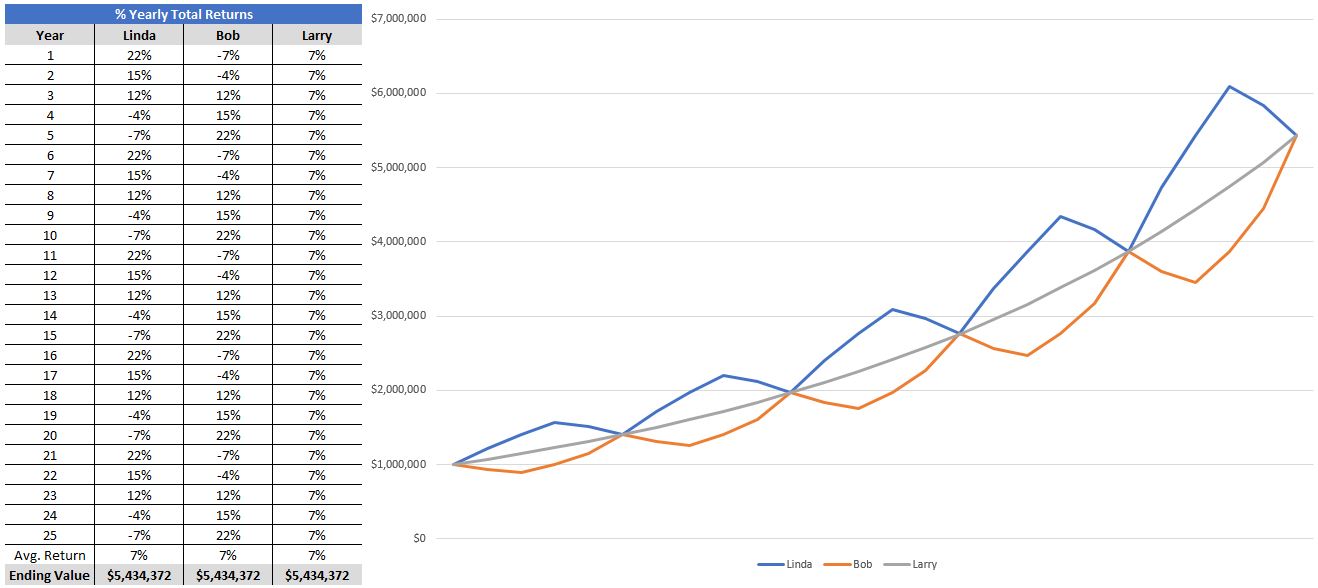
Let’s look at a few different combinations of potential returns throughout the accumulation phase. Here are three fictional investors: Linda, Bob, and Larry. Each of them starts with $1mm to invest and the following is meant to represent 25 years of their possible investment performance. Linda’s returns are the same every 5 years: 22%, 15%, 12%, -4%, and -7%. Bob achieves those same results in the inverse sequence: -7%, -4%, 12%, 15%, 22% also repeated every 5 years. Larry’s returns are the same each year: 7%.
Source: Blackrock
As the investor’s assets grew, all three had a path of their own but reached the same destination. They all ended with approximately $5.4mm. The sequence of their returns did not pose any risk during their accumulation phase.
SORR Distribution
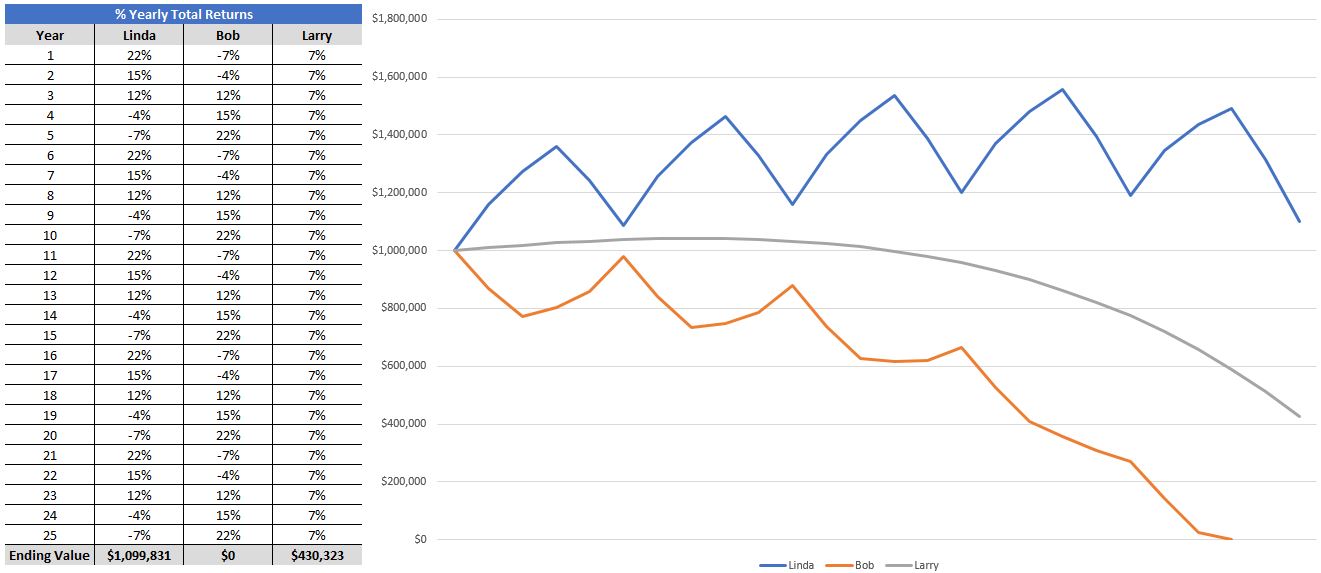
Now, let’s use the same chart, but add in one variable. Each investor starts with the same $1mm, achieves the same sequence of returns, but now is withdrawing $60k per year, and adjusting these withdrawal for inflation (3%) each year.
Source: Blackrock
Linda ended the 25 years with almost $1.1mm, Bob ran out of money in year 23, and Larry ended with about $430k. These three outcomes represent the sequence-of-returns risk.
During the distribution phase of retirement, withdrawals can accelerate the negative momentum of bad markets. Bob started off retirement with returns of -7% and -4%, which didn’t alter his outcome when accumulating, but when he also took out 6% each year that accelerated the erosion of his nest egg. Think about Bob’s first couple of years of retirement: His $1mm went down 7% making it $930k, then he withdrew $60k, next year it was down another 4% and he made another withdrawal of $60k. Within the first two years Bob had already lopped off about 22.5% of his savings.
Here’s an important truth to remember – your nest egg doesn’t know the difference between negative returns and withdrawals, they both shrink the total. It also doesn’t know the difference between positive returns and contributions, which grow the total.
So, What’s the Moral of The Story?
I am passionate about this topic because I am a financial planner who helps people achieve their retirement goals. Moreover, in the distribution phase of retirement you don’t get any do-overs or mulligans. Doing things right the first time is key.
One must balance the need for preservation and growth. This means that you must avoid large drawdowns during retirement when you are depending on withdrawals from your portfolio. You must also grow your portfolio to keep up with inflation and maintain the buying power of your nest egg. These are two of the primary reasons that The Bahnsen Group is intentional about creating client portfolios that generate sustainable and growing cash flow. When the income generated from a portfolio can meet the spending needs of a investor then SORR becomes less of an issue.
Not Hypothetical but Real Life
One argument that I might pose against today’s observations is that everything we reviewed was in the form of a hypothetical. The returns were made up, and the investors were fictional. So how might this look like in real life?
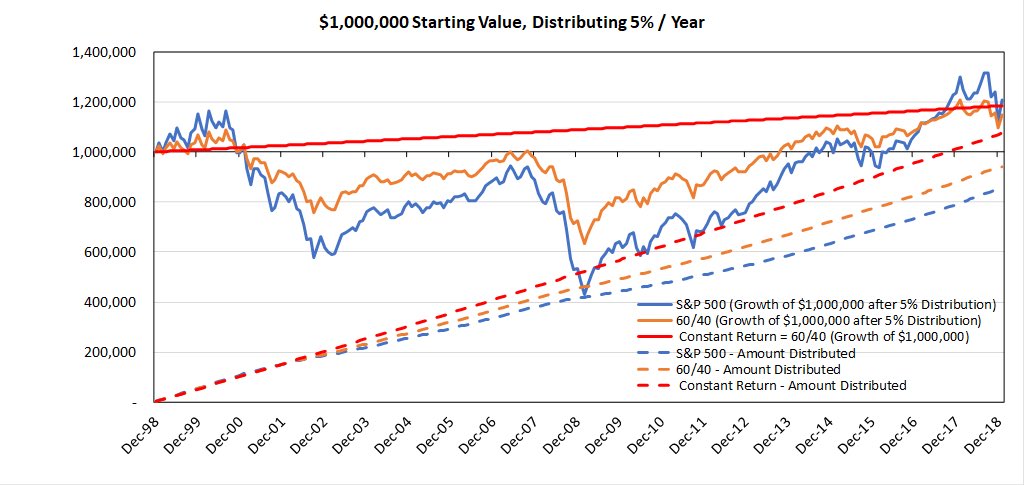
The EconomPic Data blog created a comparative graph that showed a $1mm starting value, like our example, and a 5% per year constant withdrawal. This illustration is for the 20 years spanning from 1998 to 2018 with three different investment portfolios: 100% S&P 500 (stocks), 60/40 (60% stocks & 40% bonds), and a hypothetical constant return. Although the constant return example is a hypothetical, it is included to show the relationship between volatility and withdrawals, specifically the negatives effects. Additionally, the graph includes the cumulative total of those withdrawals (constant 5%) represented by the dotted lines.
Source: EconomPic Data Blog
The primary takeaway here is that although all three portfolios ended with approximately the same value, they each distributed different amounts over the 20-years. The portfolio with the highest volatility provided the lowest total distribution while the portfolio with the least volatility provided the highest total distribution.
There is a lot more that could be unpacked here, but it’s important to remember this relationship between volatility and distributions, as this is where the SORR “point” comes into play.
What’s an Investor to Do?
Here are some practical ideas of how an advisor might help an investor prepare for retirement in light of SORR:
- Build a portfolio of income-producing assets that distribute cash to avoid having to sell shares or units to meet withdrawal needs.
- Manage the risk of the portfolio to assure that the volatility doesn’t create a hindrance to future withdrawal plans.
- Create a financial plan, and cash flow forecast BEFORE an investor retires.
- Run a Monte Carlo Simulation to “stress test” the portfolio and see how it stands up in differing market conditions.
- Plan social security distributions to help supplement expense needs and relieve the portfolio from excessive withdrawals.
- Adjust spending to assure a sustainable withdrawal rate.
The above is an excellent checklist to discuss with your advisor. Because each investor will have their unique circumstances, the value of a quality advisor will be evident as he/she walks you through the additional steps and discussions necessary in managing your retirement.
Don’t be a victim of this very SORR Subject or be on the wrong end of a losing bingo game! No one likes a SORR loser. Take the appropriate steps needed to plan and prepare accordingly.
I hope you enjoyed today’s topic and please do send over your questions and ideas for future TOM discussions. You can reach me at . This is TOM signing off, see you next week!


