

So, you’ve decided that you are going to purchase a new vehicle and you’ve narrowed your focus down to one particular make and model. You’ve even determined the color along with all the bells and whistles you’d like on this new gem. Then, you can’t help but notice your desired automobile everywhere – on the freeway, driveways in your neighborhood, the parking garage at work, etc. It “feels” like now that you’ve concluded your target buy that there has been a dramatic increase this week in the prevalence of this particular vehicle.
You wonder… Did your neighbors go through the same process you are experiencing and just beat you to the punch at the car dealership? Is your community just one step ahead of you regarding this dramatic increase in your dream car? The answer is no. You are experiencing the Baader-Meinhof phenomenon (or frequency illusion). Your increased awareness is leading to a cognitive bias that this particular thing is more prevalent. One of those weird tricks our brains can play on us.
So, I’ll ask you this? Have you had a slight fear about an impending recession? Can you not help but notice how many headlines and conversations you see on this very subject? Is it hard not to continue to compile support for this fear and concern? There is some frequency illusion at play here. Yes, you can counter my argument with the fact that there has been an actual increase in recession talk in the cultural conversation we all follow; a quick Google trends search would support your argument here. What I am proposing though, is that this conversation is being amplified, as we are all feeding this bias and anxiety.
Let me take this one step further, what is your actual fear? That you will lose your job? That you will outlive your nest egg? Again, the answer here could be different for all of us, but peeling back the layers is important. I’ve had many conversations recently where I have seen the fear of recession paralyze individuals from being able to design and execute aspects of their financial plan. The “what-if” enemy has people absolutely frozen in their tracks. By identifying and calling out your fear specifically you can measure and address this concern in your planning.
Today, I thought it would be both appropriate and interesting to zoom in on some contrarian indicators. These are measuring sticks or alerts that may encourage us to stray from the herd. Rejecting the common perspective of the day is not easy, but as famed investor Howard Marks puts it,
“Not only should the lonely and uncomfortable position be tolerated, it should be celebrated. Usually – and certainly at the extremes of the pendulum’s swing – being part of the herd should be reason for worry.”
So, without further ado, let’s jump right into some of these contrarian indicators and see if the data might reveal to us at what level that pendulum currently sits…
From the Horses Mouth
One of the most direct ways to measure investor sentiment is to just ask investors directly – are you bullish, bearish, or neutral? The American Association of Individual Investors does just that, “The AAII Sentiment Survey offers insight into the opinions of individual investors by asking them their thoughts on where the market is heading in the next six months and has been doing so since 1987.” This data is updated and published weekly.
Historically, peaks in optimism have coincided with market peaks, and peaks in pessimism have often correlated with market bottoms. Essentially, for a contrarian, a relatively negative reading here would represent an attracttive entry point.
Here’s a look at the data going back to 1987:
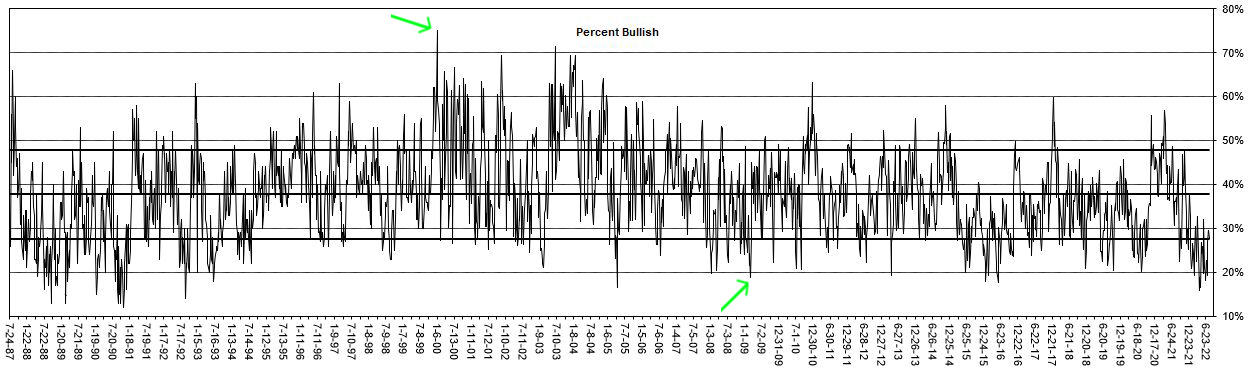
For context, I highlighted (green arrow) the peak bullishness in 2000 right before the tech bubble crashed and one of the deepest lack of bullishness (bearishness) in 2009 at the start of the recovery from the Great Financial Crisis. The conclusion here is that following the herd into euphoria or fear has not served investors well.
Note, that the most current survey readings are fairly neutral.
Paying for Profits
We must always contextualize any of these metrics by holding them up against history and relating the “now” to the average, and to other relevant/similar time periods. Additionally, we must be aware of what variables might make this current time period unique or different. We will be careful here too, as the goal is not to constantly conclude “this time is different,” which is often the death kiss for an investment thesis.
With that said, one simple way to measure if the stock market is cheap or expensive is to look at how many dollars – in a stock price – that you pay for every dollar of earnings the underlying companies are creating. We call this the price-to-earnings ratio, or PE ratio. Here is a look at that data going back to the great depression:
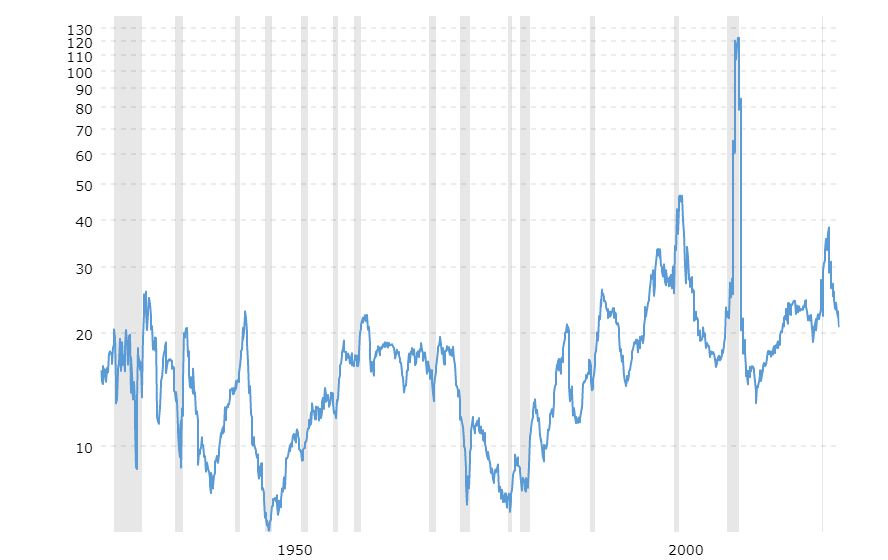
Source: MacroTrends
How does the current multiple stack up versus history? Well, we are sitting in the 20 range – that is to say that investors are paying $20 per $1 of earnings – and historical averages land in about the 16 to 17 range. At first glance, this may seem a bit rich or expensive, but again, we have to factor in the context of the current environment. One could craft an argument that the interest rate regime that we’ve had post-financial crisis justifies a slightly higher than average multiple. We have spent the last 8 years or so above where we sit today, excluding one exception.
To me, the conclusion here is also neutral. Markets are not screaming cheap, but they also are not obnoxiously expensive. A fun fact, the markets traded at a multiple of 40 at the peak of the tech bubble (the early 2000s), which led to what we call the lost decade, a 10-year annualized return for the market that was negative. Japan, on the other hand, amplified this even further, their PE bubble led to the lost decades – emphasis on the plural – that was 30 years of go-no-where for their market.
What’s the Spread?
Another way to check in on investor appetite for risk is to look at where credit spreads sit. Simply put, you can measure how much more interest a junk bond pays versus a government treasury. This spread gets wide when investors or leary of risk and tightens when investors have a strong risk appetite.
Sticking with the theme of holding metrics in the context of history, here is a look at credit spreads:
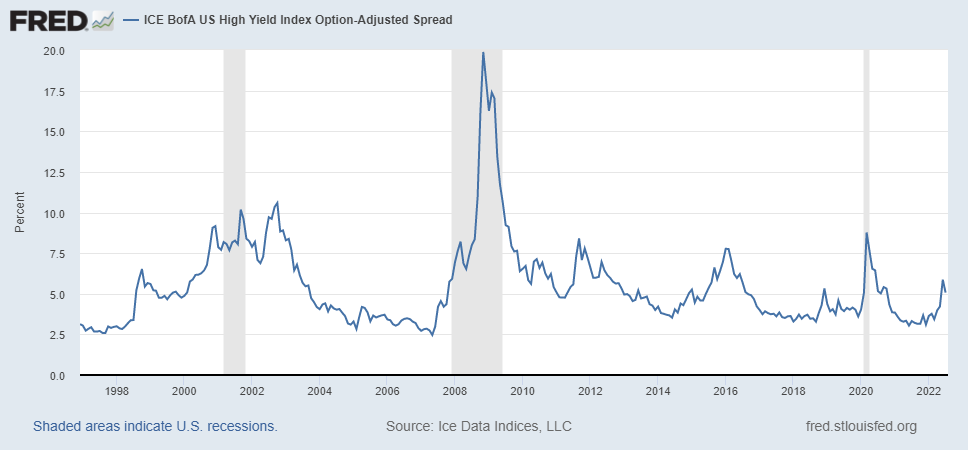
Why the gyration or expansion/contraction here? Well, if investors think something scary is coming down the pike they are going to flee from “risky” assets as they fear these bonds may default and the result is higher yields for riskier bonds.
The grey lines in the graph above represent past recessions and you can see how the peaks coincide with maximum credit spreads. If you were to study further you would also see that junk bonds (or high yield debt) typically have a quicker recovery post-recession than the stock market. Why so? Well, the simple answer may be that bond investors are smarter or that once the dust settles, it’s a bit easier to do the bond math and underwriting to realize that defaults will be lower than assumed. Investors tend to overestimate on both ends – in the name of fear and greed.
So, what do credit spreads tell us today – they tell us that investors are cautious. I’ll plug in a Sir John Templeton quote here,
“Bull markets are born on pessimism, grow on skepticism, mature on optimism and die on euphoria.”
Advisor Anecdotes
The water cooler talk around the office of an advisory firm can also usually offer some clues to where investor sentiment stands. An advisor will commonly talk to half a dozen or so investors per day. These conversations reveal patterns and leave clues to what’s on the “average” investor’s mind. Obviously, a one-off conversation does not provide a sufficient sample size but put together a week’s worth of dialogues multiplied by a room full of advisors and you can start to get a good gauge.
Essentially, not a perfect measuring stick, but a heavy influx of concern in a concentrated time period will usually be an indicator to me that outcomes will soon begin to sway in a positive direction.
So, what’s the current portfolio blemish that is attracting the most concern and criticism? Easy answer, the emerging markets. Perhaps, just for research benefits, we should mark this date in the calendar as a look back at where things go from here. Again, with the high focus and unloved demeanor surrounding this allocation, it will be interesting to see how the next chapter plays out.
Note, on a broader level, not a day goes by in the most recent past (the last 90 days) where I don’t have at least one conversation in which an investor shares their concerns about where the economy or the stock market currently stands. Often referred to as a gut feeling that this shaky ground is detracting interest from deploying new money into the stock market. This next comment is not a criticism of these comments, but I will tell you that as a contrarian at heart, this type of language and perspective motivates me as a potential buyer/investor.
A Contrarians Conclusion
The most important thing I will tell you today – none of these metrics in isolation will tell the whole story and even collectively they are not easily actionable around timing markets. I provide these contrarian indicators to start building a picture that might expand your paradigm. The context here can build better investor behavior and help you combat some of your natural cognitive biases.
And there are a whole lot of other metrics and measurements that we could dive into as well. David often references the put-call ratio on DC Today, which is another great reference point.
All this to say, for me personally, I think the general fear and anxiety around markets right now is the pendulum swinging a bit to one side. I don’t think investors are at maximum levels of fear and I don’t think stock prices are trading at historically deep discounts, but I do think the anxiety levels right now are higher than warranted. My hope is that this conclusion can be comforting to you and minimally that it would encourage you to share your fears and concerns with your advisor. Sometimes a discussion alone can be therapeutic.
As always, we are here to be a resource, so please do reach out any time.
And, of course, I will be back next week with more of my Thoughts On Money.