Dear Valued Clients and Friends,
History was made this week, and no, I am not talking about DA Jack McCoy retiring after 400 episodes on Law & Order, but rather the Japanese Nikkei closing at 39,098 on Wednesday night, its highest close in history, surpassing the previous closing high … which was (wait for it) … December 29, 1989. Yes, almost 35 years ago, the Nikkei closed at 38,916 and finally re-reached and exceeded that level this week. It gives new meaning to the expression “buy and hold.”
But beyond the statistical and numerical takeaways of what may seem like a distant story unrelated to the plight of American investors, the tale of modern finance embedded in the last four decades of Japanese economic life is one for the ages. It has been a mild obsession of mine for many years, and I fully intend to finish a deeper white paper on the entire saga in the years to come. But today is not that white paper, as exciting for your insomnia as that prospect may be. Rather, I want to provide a succinct look at the history of what happened and what a key, if not the key, takeaway of the whole thing is for American investors.
Jump on into the Dividend Cafe, and let’s pretend we left off in the mid-1980s, in a very different time than we find ourselves today, Yet in many ways, perhaps not that different at all.
|
Subscribe on |
From Point A to Point B
Here you see what I refer to – a massive asset bubble that formed in Japan in the late 1980’s, a spectacular crash that followed, a few lost decades that followed that, and a stock price recovery in recent years to bring them back to where it left off at the end of 1989.
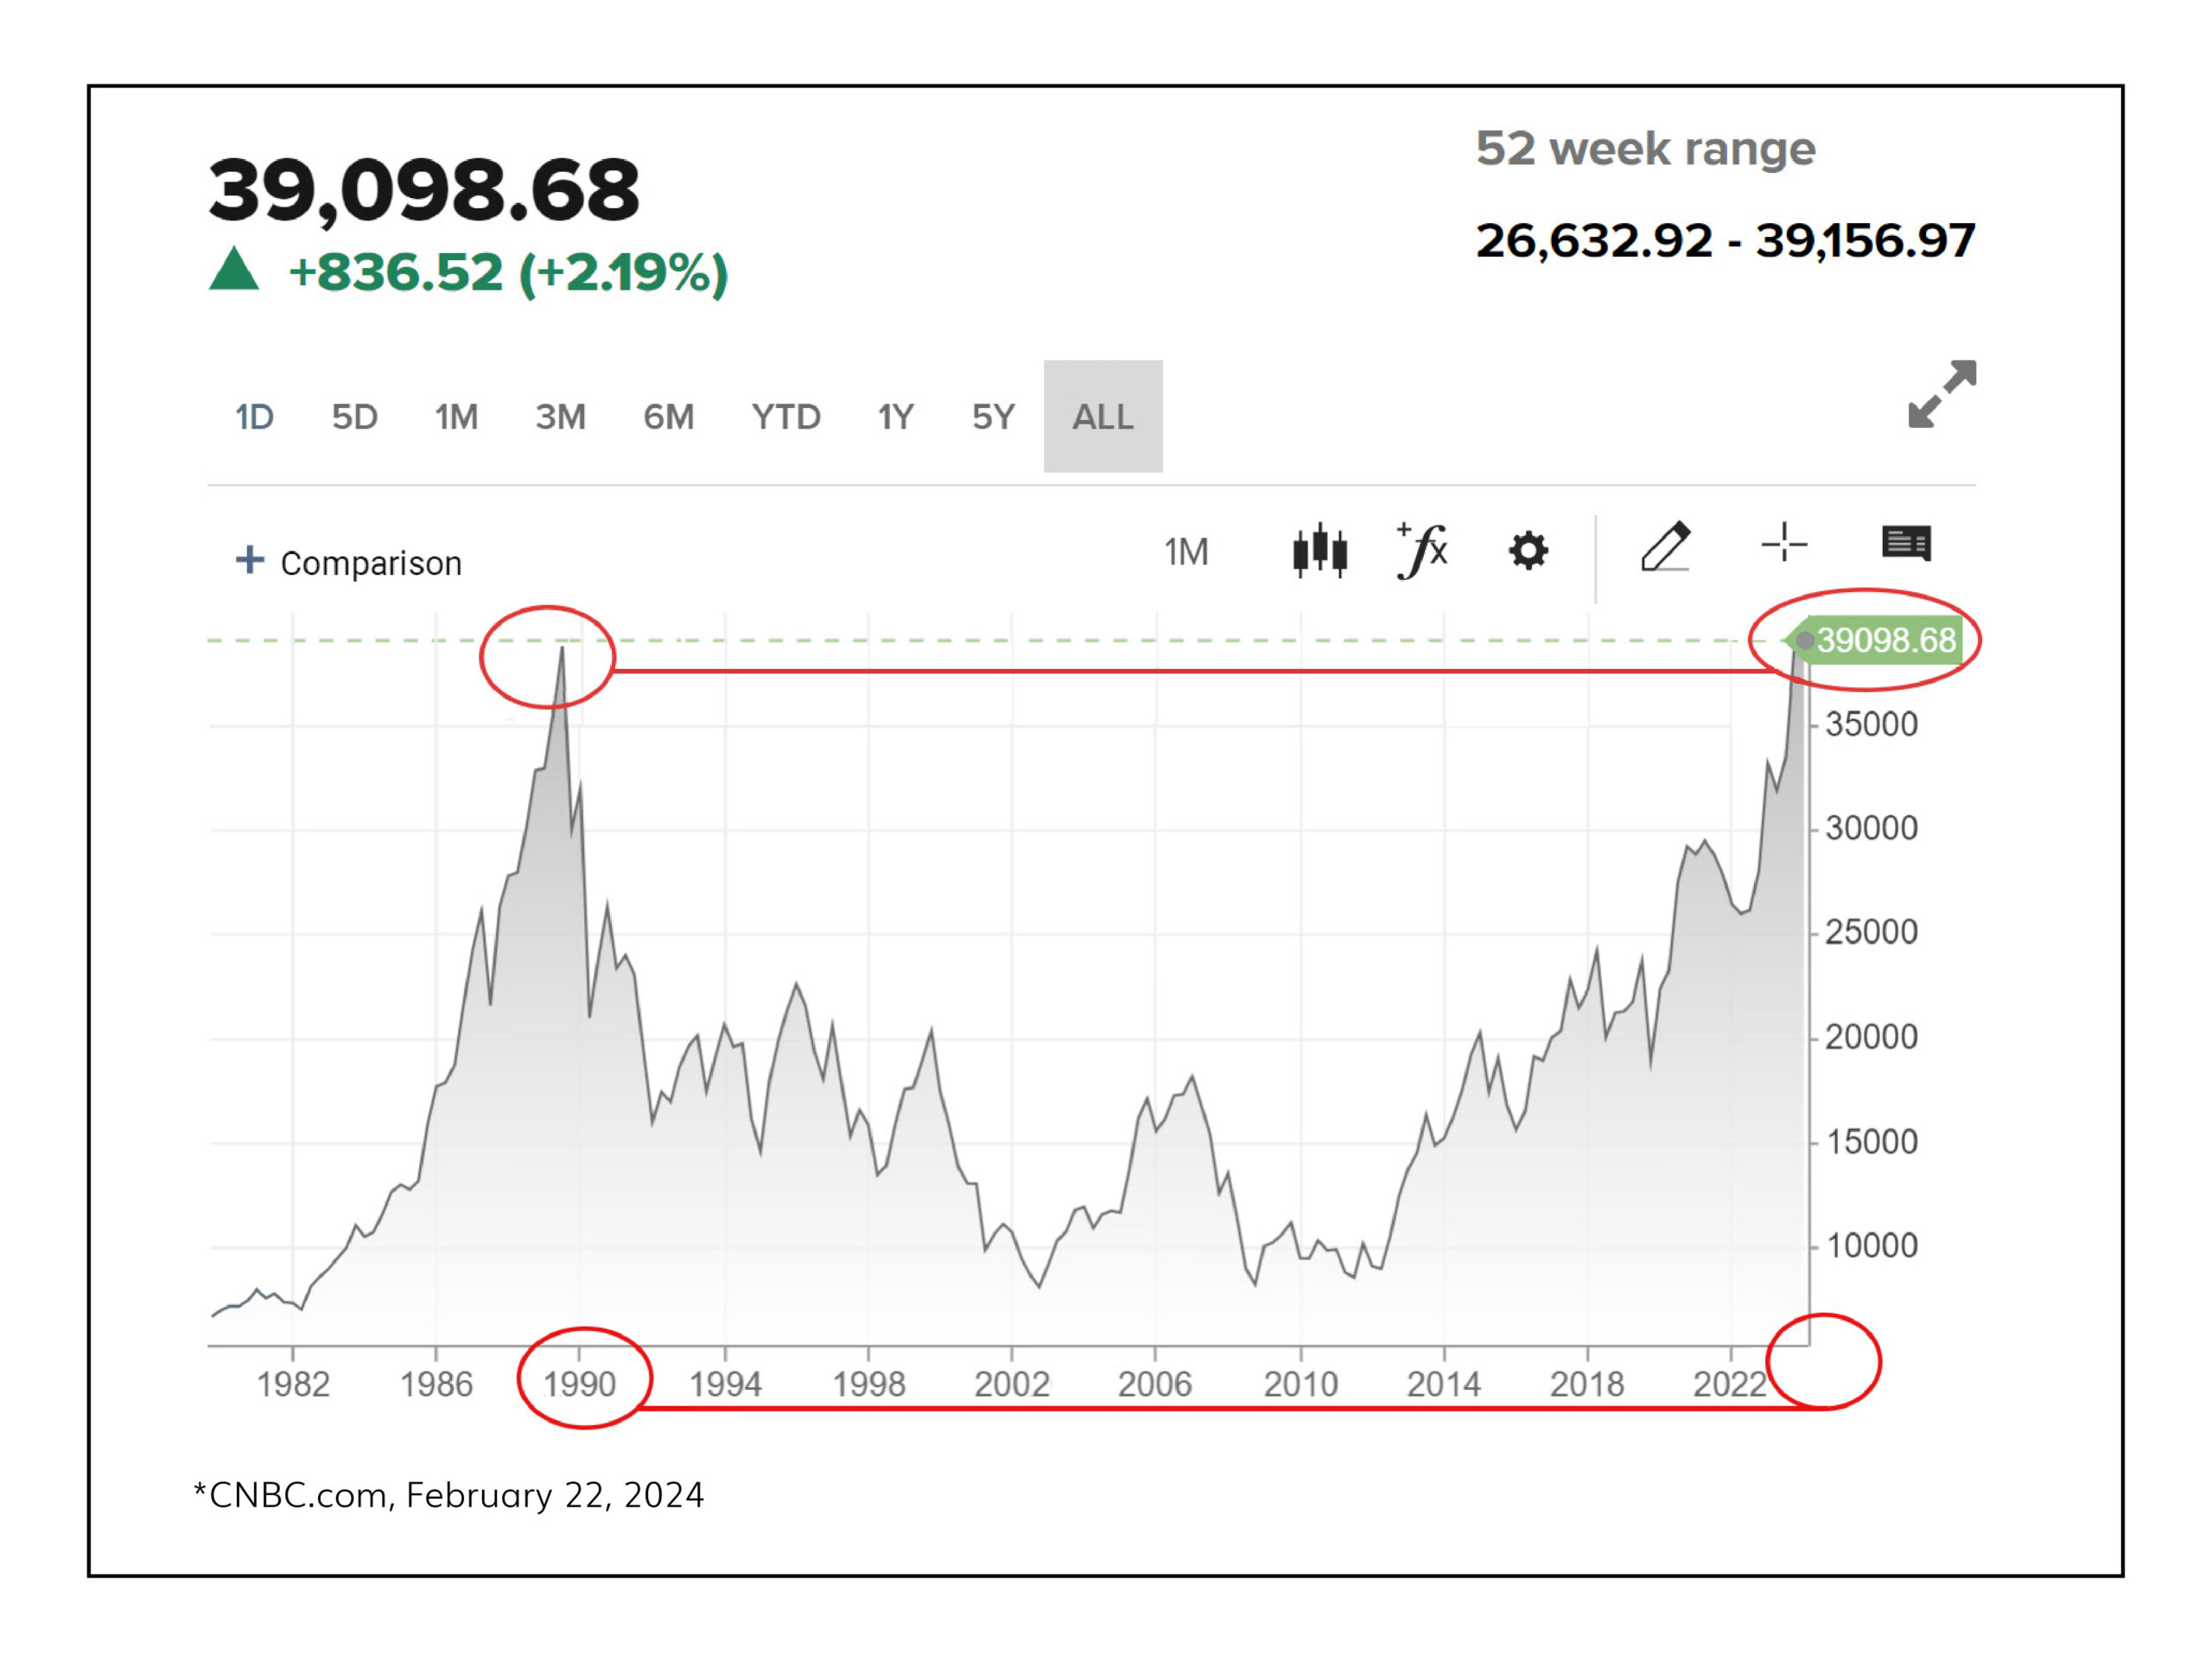
*CNBC.com, Feb. 22, 2024
The fundamental question(s) that the above chart presents seem to me to be:
(1) How does a bubble form like that?
(2) How does a bubble burst like that?
(3) How do 30+ years get taken out in the aftermath of such a boom and a bust?
(4) How have things more recently recovered?
And I would add for our purposes, (5) What does it mean for us?
Madonna, Prince, UCLA football, and the Plaza Accord
The mid-1980s were not just a time of pop music chart ascension for single-name artists, and it was not just the last time UCLA football won a Rose Bowl. I mean, all that is true, but it is also true that the U.S. dollar was on a tear, and a consortium of major, developed sovereign nations met in 1985 to concoct an orderly depreciation of the U.S. dollar for the collective benefits of all. This was pre-Euro, of course, so the French franc, the German Deutsche Mark, the British pound, and the Japanese Yen were all involved. The ascension of the dollar in the first half of the decade was logical – the U.S. economy had improved dramatically, inflation had been moderated, capital flows were extremely robust, tax and regulation had become more friendly, and competitive advantages, as well as relative geopolitical strength, were leading many to love the U.S. dollar. Of course, this reached a point where it had an impact on U.S. manufacturers, exporters, and even farmers, and there was broad consensus that some moderating of dollar strength was needed.
Well, be careful what you wish for. While the agreement was intended to be small and orderly, the messaging to markets was huge. And the reality was that the U.S. bought a LOT from Japan, and they had very little they needed to buy from us. The accord took off the brakes and allowed the Yen to rally significantly, creating significant pressures on Japan’s export-driven economies (either provoking one long, choppy recession or a couple of mini-recessions, depending on how you look at it).
This leads to that and that leads to this
And so this led to the next round of ping-pong – aggressive fiscal and monetary actions by Japan to counter-act the economic consequences of a rising Yen. This involved some of the most aggressive public investment in world history, hyper-aggressive monetary stimulus, and unprecedented interventions to attempt to stimulate in the face of a rising Yen. This “curbing” of Yen strength using fiscal spending and monetary policy came with a massive side effect that would prove much stronger than the recessionary concerns they had from the strong yen or the economic benefits they were trying to create with a weaker Yen:
It led to the mother of all asset bubbles.
A bubble by any other name
In what way does Japan’s asset bubble trounce the embarrassment of the U.S. dotcom bubble and even the 2008 housing bubble? Consider the following:
- Commercial real estate in Japan was up +122% in 1986 alone – one single year. It would increase in asking price by +96% for three years in a row.
- Residential real estate was up +45% in just a few months in 1996 and would compound at +89% per year for three years.
- At one point, the land value of Tokyo Imperial Palace was worth more than all of California’s real estate
- Land was selling for $145 per square inch. Not square mile – square inch. $145 per inch. I can keep typing it over and over if you want.
- The Nikkei stock market went up 300% – also not a typo – from 1986 to 1989 – a TRIPLING of stock prices in just three years!
- The price-earnings ratio for the Nikkei at this time became something in the range of 50x (it is hard to precisely identify it because of cyclical adjustments), more or less double the valuation of the worst U.S. bubble in stock market history (2000), where our own valuation was nearly double its historical average. I mean, this was just utter insanity.
- It was not just domestic purchases making more sense for a credit-expansion-gone-mad Japanese economy … The glut of Yen and no credit creation meant foreign investment had to take place to match supply with [credit-created] demand. The result was an $850 million purchase of Pebble Beach, a $1.4 billion purchase of Rockefeller Center, and more foreign real estate purchases than one would believe
And then, gravity
The crash in 1990 was quick. Stocks dropped -35% just to kick things off. Land values plummeted. Loan defaults surged. Banks collapsed. And when all was said and done, trillions of yen of bad debt had to be written down. The bubble was spectacular, but the bubble burst was even more so. Debts could not be written down fast enough as asset prices dropped even quicker than loans could be exterminated. The deflationary spiral was “classic,” but it was violent.
And it launched the beginning of three decades of economic dormancy.
The tangled web that was weaved gave us this
I have written ad nauseam of the low/slow/no growth that Japan suffered in the aftermath of this collapse of asset prices (that collapse being the unwind of an asset price inflation bubble).
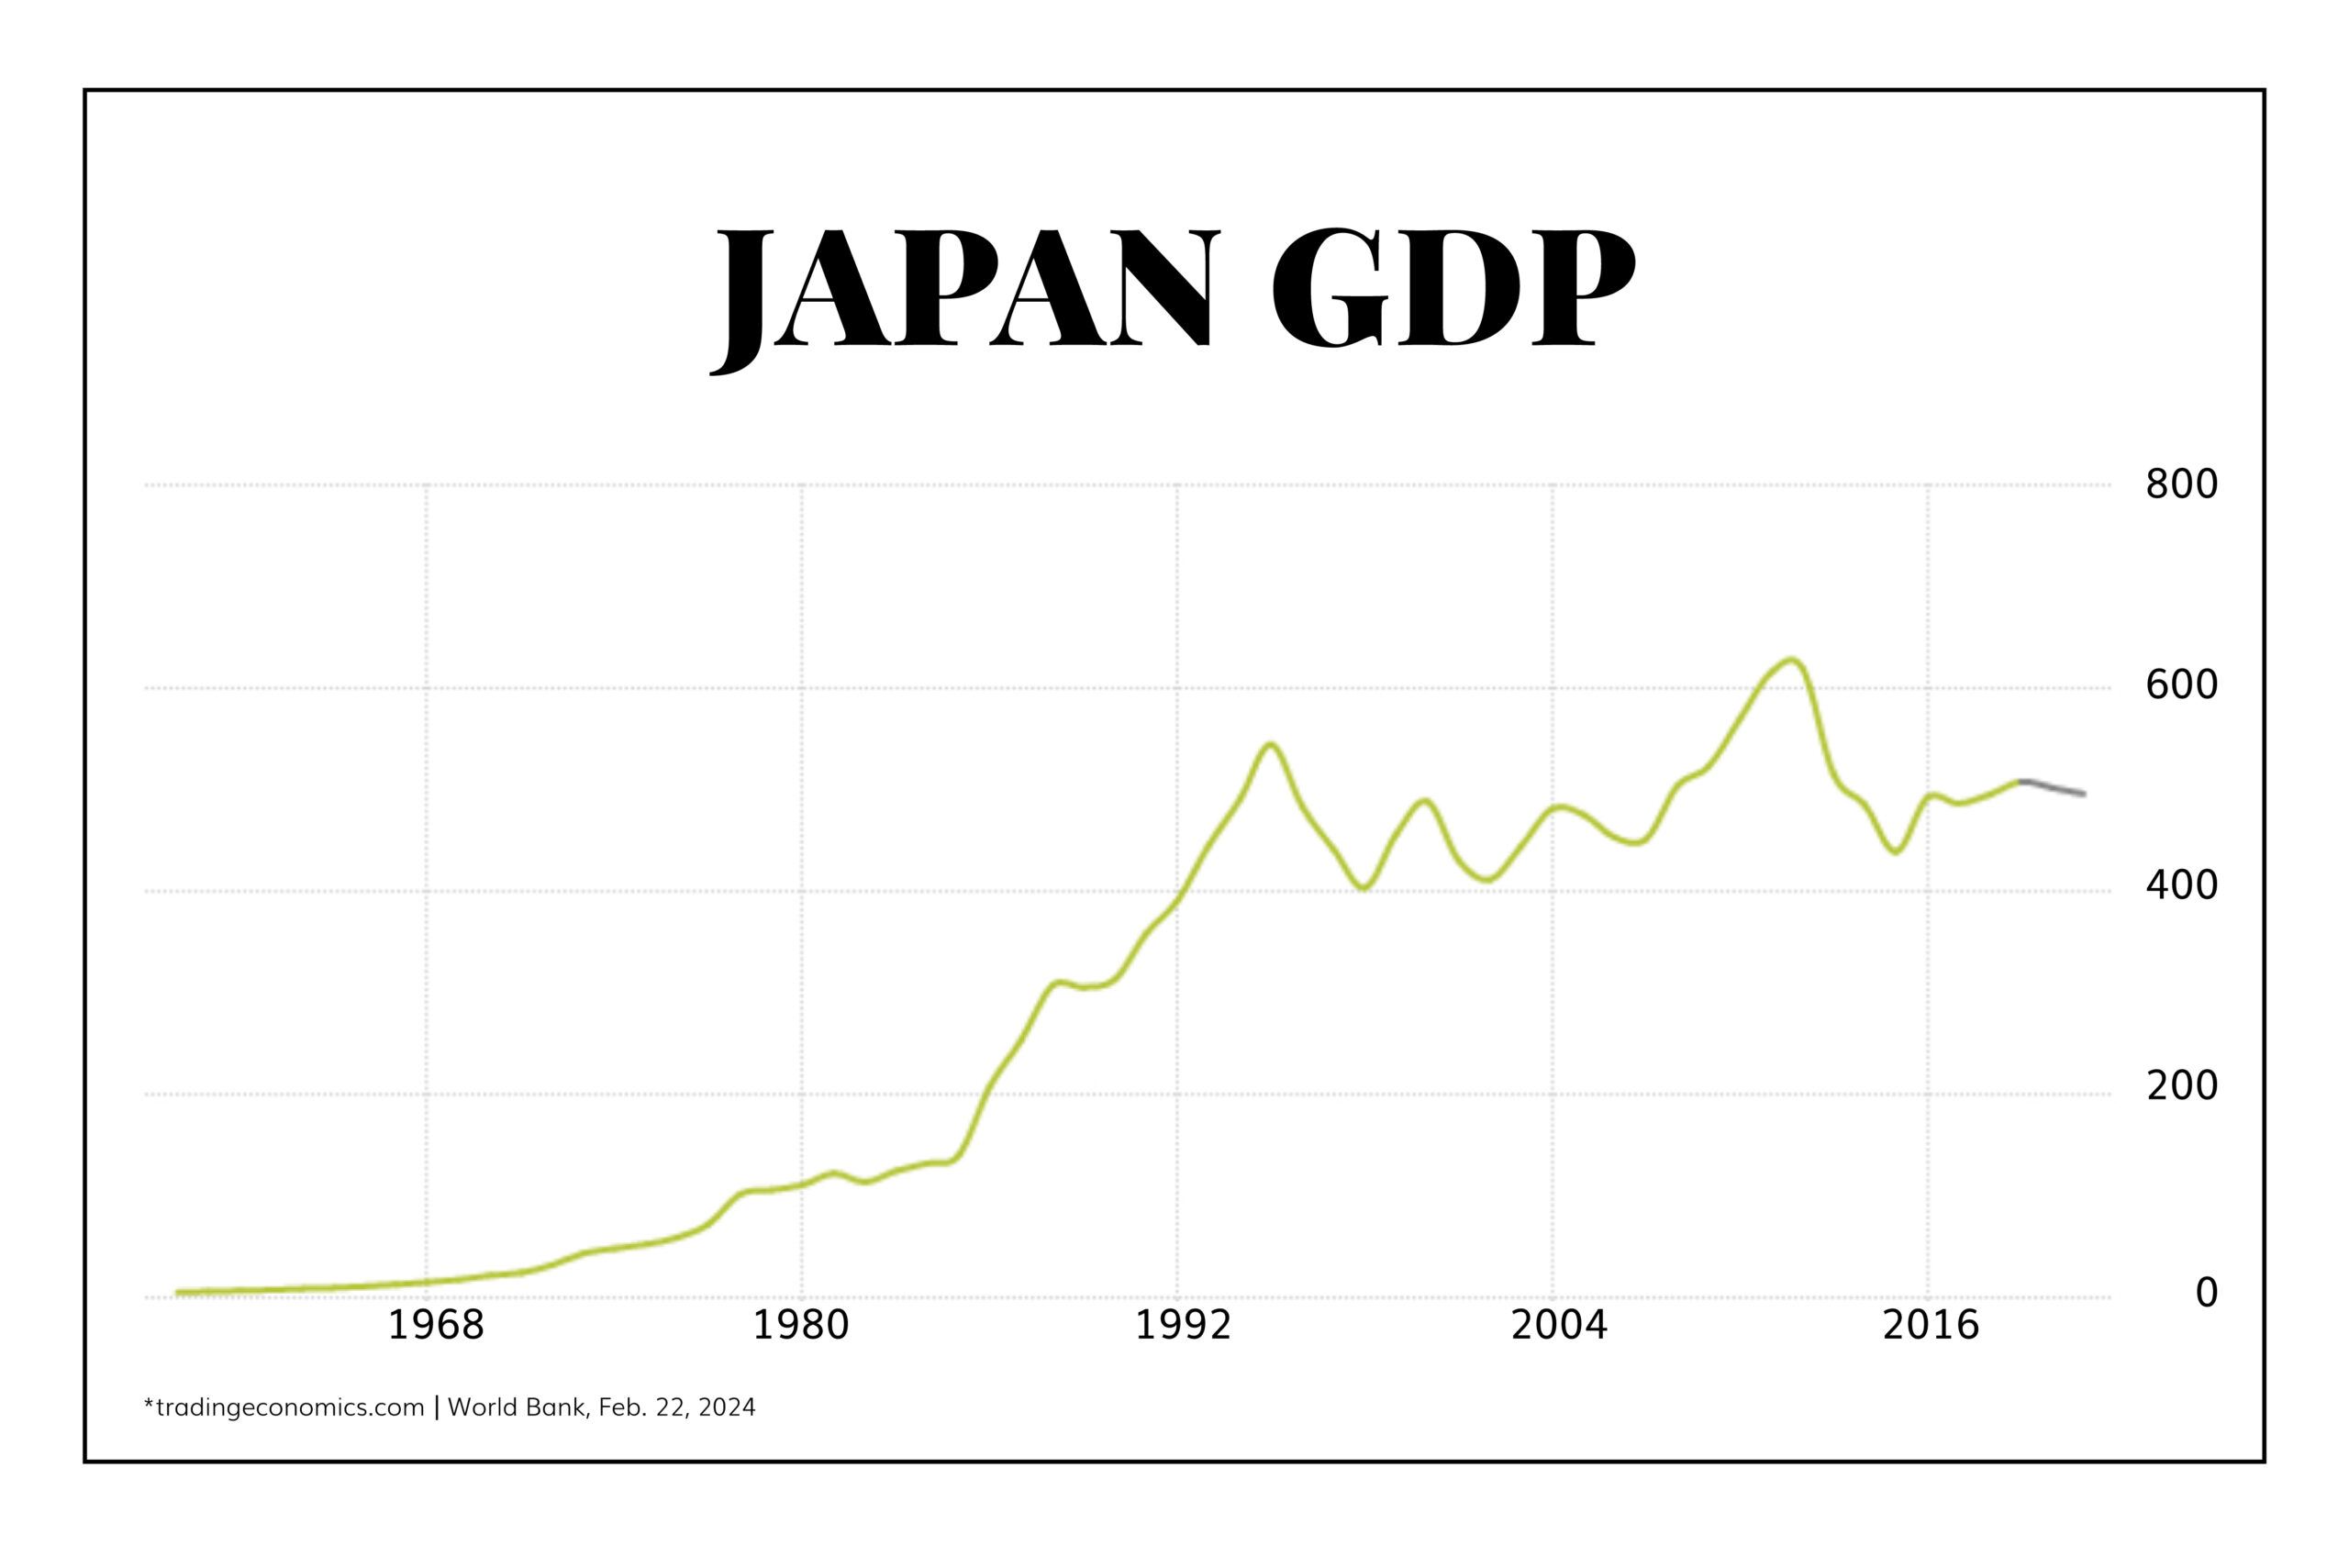
You don’t get three decades of no stock market growth without (a) The unwinding of an asset bubble to kick it off and (b) Three decades of no economic growth.
Japan had both.
The consumer went away. Manufacturing and technology evaporated. A global competitive edge was lost. And zombie banks were kept alive, lending to zombie companies, keeping zombie capital in zombie businesses facilitating a zombie economy. I hope you get my point – it was not good. And soon, this will become the whole point.
Stocks were down -82% from 1989 until the bottom of 2009. I am cherry-picking the bottom there to make the point – it was a wholesale collapse that lasted a long, long time.
The recent recovery
The Nikkei is up +550% since 2009, and stocks are up +45% in the last year (+15% in the last ninety days). Foreign investors have come back, largely as they have abandoned China and Hong Kong. Shanghai’s index is down -11% while Hong Kong is down -22%. Corporate earnings are up nicely in Japan compared to past years, though economic conditions are still questionable. Governance has improved substantially, and the P/E ratio has gotten back to a whopping 16x (still far lower than the S&P’s 22x). China’s problems have become Japan’s gains. And here we are.
The U.S. lesson
I have already written dozens of times about the negative feedback loop that is created by excessive fiscal and monetary interventions to distortively treat economic woes. I call this Japanification for a reason, and it is more of a descriptive term for economic impact (low/slow/no growth that results) than a comment on asset prices.
But the single biggest thing I want to point out from Japan’s saga is the way in which it was prolonged by refusing to accept Schumpterian laws of creative destruction. Failing to let banks fail and failing to let failed businesses fail did not help anyone. It forced capital resources to stay in unproductive places and kept resources from getting to productive places. The body cannot heal itself when the immune system is turned off. Japan tried to help a problem, understandably, but in so doing, made it much, much worse. And it certainly made it last much, much longer.
Capital that is manipulated by interventionist monetary policy does not optimally find its most productive use. And capital that stays in unproductive use means you will have a less productive economy. For some, it might even mean 35 lost years.
I do not believe the U.S. could ever see what happened in Japan, at least in the identical fact pattern and context. My point here is the marginal movements towards growth or away from growth that our policy decisions facilitate. This is no doomsday piece. We have learned plenty of lessons and done plenty of things right, and enjoy structural advantages that give us huge benefits versus what Japan went through. But that does not mean we should play footsies with the unproductive use of capital. And I am afraid we have done far more than just play footsies.
Quote of the Week
“A pessimist sees the difficulty in every opportunity; an optimist sees the opportunity in every difficulty.”
~ Sir Winston Churchill
* * *
Jumping on a plane now back to California. I am excited to be at the home base, to be in our Phoenix office next week, and to continue doing what we do full-time …
With regards,
David L. Bahnsen
Chief Investment Officer, Managing Partner
The Bahnsen Group
thebahnsengroup.com
This week’s Dividend Cafe features research from S&P, Baird, Barclays, Goldman Sachs, and the IRN research platform of FactSet